
Page 30 - Azerbaijan State University of Economics
P. 30
THE JOURNAL OF ECONOMIC SCIENCES: THEORY AND PRACTICE, V.71, # 1, 2014, pp. 26-39
the remaining leading sectors in this case including; mining, paper and paper products, painting
industry, plastic industry and water supply, all of which are purchased by virtually every sector
in the economy.
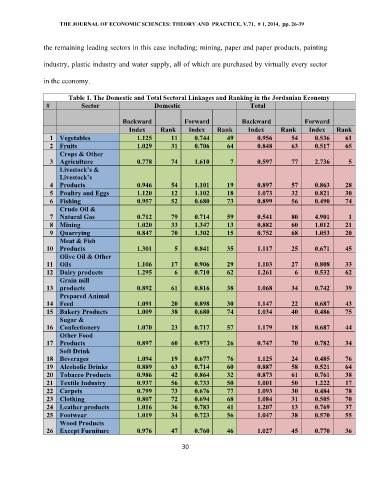
Table 1. The Domestic and Total Sectoral Linkages and Ranking in the Jordanian Economy
# Sector Domestic Total
Backward Forward Backward Forward
Index Rank Index Rank Index Rank Index Rank
1 Vegetables 1.125 11 0.744 49 0.956 54 0.536 61
2 Fruits 1.029 31 0.706 64 0.848 63 0.517 65
Crops & Other
3 Agriculture 0.778 74 1.610 7 0.597 77 2.736 5
Livestock’s &
Livestock’s
4 Products 0.946 54 1.101 19 0.897 57 0.863 28
5 Poultry and Eggs 1.120 12 1.102 18 1.073 32 0.821 30
6 Fishing 0.957 52 0.680 73 0.899 56 0.490 74
Crude Oil &
7 Natural Gas 0.712 79 0.714 59 0.541 80 4.901 1
8 Mining 1.020 33 1.347 13 0.882 60 1.012 21
9 Quarrying 0.847 70 1.302 15 0.752 68 1.053 20
Meat & Fish
10 Products 1.301 5 0.841 35 1.117 25 0.671 45
Olive Oil & Other
11 Oils 1.106 17 0.906 29 1.103 27 0.808 33
12 Dairy products 1.295 6 0.710 62 1.261 6 0.532 62
Grain mill
13 products 0.892 61 0.816 38 1.068 34 0.742 39
Prepared Animal
14 Feed 1.091 20 0.898 30 1.147 22 0.687 43
15 Bakery Products 1.009 38 0.680 74 1.034 40 0.486 75
Sugar &
16 Confectionery 1.070 23 0.717 57 1.179 18 0.687 44
Other Food
17 Products 0.897 60 0.973 26 0.747 70 0.782 34
Soft Drink
18 Beverages 1.094 19 0.677 76 1.125 24 0.485 76
19 Alcoholic Drinks 0.889 63 0.714 60 0.887 58 0.521 64
20 Tobacco Products 0.986 42 0.864 32 0.873 61 0.761 38
21 Textile Industry 0.937 56 0.733 50 1.001 50 1.222 17
22 Carpets 0.799 73 0.676 77 1.093 30 0.484 78
23 Clothing 0.807 72 0.694 68 1.084 31 0.505 70
24 Leather products 1.016 36 0.783 41 1.207 13 0.769 37
25 Footwear 1.019 34 0.723 56 1.047 38 0.570 55
Wood Products
26 Except Furniture 0.976 47 0.760 46 1.027 45 0.770 36
30