
Page 79 - Azerbaijan State University of Economics
P. 79
THE JOURNAL OF ECONOMIC SCIENCES: THEORY AND PRACTICE, V.71, # 1, 2014, pp. 53-79
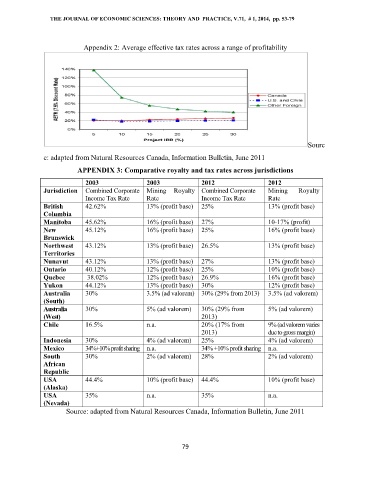
Appendix 2: Average effective tax rates across a range of profitability
Sourc
e: adapted from Natural Resources Canada, Information Bulletin, June 2011
APPENDIX 3: Comparative royalty and tax rates across jurisdictions
2003 2003 2012 2012
Jurisdiction Combined Corporate Mining Royalty Combined Corporate Mining Royalty
Income Tax Rate Rate Income Tax Rate Rate
British 42.62% 13% (profit base) 25% 13% (profit base)
Columbia
Manitoba 45.62% 16% (profit base) 27% 10-17% (profit)
New 45.12% 16% (profit base) 25% 16% (profit base)
Brunswick
Northwest 43.12% 13% (profit base) 26.5% 13% (profit base)
Territories
Nunavut 43.12% 13% (profit base) 27% 13% (profit base)
Ontario 40.12% 12% (profit base) 25% 10% (profit base)
Quebec 38.02% 12% (profit base) 26.9% 16% (profit base)
Yukon 44.12% 13% (profit base) 30% 12% (profit base)
Australia 30% 3.5% (ad valorem) 30% (29% from 2013) 3.5% (ad valorem)
(South)
Australia 30% 5% (ad valorem) 30% (29% from 5% (ad valorem)
(West) 2013)
Chile 16.5% n.a. 20% (17% from 9% (ad valorem varies
2013) due to gross margin)
Indonesia 30% 4% (ad valorem) 25% 4% (ad valorem)
Mexico 34%+10% profit sharing n.a. 34% +10% profit sharing n.a.
South 30% 2% (ad valorem) 28% 2% (ad valorem)
African
Republic
USA 44.4% 10% (profit base) 44.4% 10% (profit base)
(Alaska)
USA 35% n.a. 35% n.a.
(Nevada)
Source: adapted from Natural Resources Canada, Information Bulletin, June 2011
79