
Page 32 - Azerbaijan State University of Economics
P. 32
THE JOURNAL OF ECONOMIC SCIENCES: THEORY AND PRACTICE, V.73, # 1, 2016, pp. 4-37
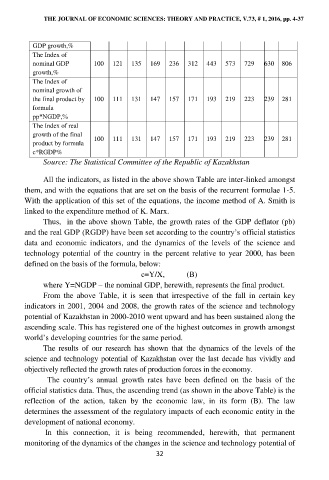
GDP growth,%
The Index of
nominal GDP 100 121 135 169 236 312 443 573 729 630 806
growth,%
The Index of
nominal growth of
the final product by 100 111 131 147 157 171 193 219 223 239 281
formula
рр*NGDP,%
The Index of real
growth of the final 100 111 131 147 157 171 193 219 223 239 281
product by formula
c*RGDP%
Source: The Statistical Committee of the Republic of Kazakhstan
All the indicators, as listed in the above shown Table are inter-linked amongst
them, and with the equations that are set on the basis of the recurrent formulae 1-5.
With the application of this set of the equations, the income method of A. Smith is
linked to the expenditure method of K. Marx.
Thus, in the above shown Table, the growth rates of the GDP deflator (pb)
and the real GDP (RGDP) have been set according to the country‘s official statistics
data and economic indicators, and the dynamics of the levels of the science and
technology potential of the country in the percent relative to year 2000, has been
defined on the basis of the formula, below:
с=Y/X, (B)
where Y=NGDP – the nominal GDP, herewith, represents the final product.
From the above Table, it is seen that irrespective of the fall in certain key
indicators in 2001, 2004 and 2008, the growth rates of the science and technology
potential of Kazakhstan in 2000-2010 went upward and has been sustained along the
ascending scale. This has registered one of the highest outcomes in growth amongst
world‘s developing countries for the same period.
The results of our research has shown that the dynamics of the levels of the
science and technology potential of Kazakhstan over the last decade has vividly and
objectively reflected the growth rates of production forces in the economy.
The country‘s annual growth rates have been defined on the basis of the
official statistics data. Thus, the ascending trend (as shown in the above Table) is the
reflection of the action, taken by the economic law, in its form (B). The law
determines the assessment of the regulatory impacts of each economic entity in the
development of national economy.
In this connection, it is being recommended, herewith, that permanent
monitoring of the dynamics of the changes in the science and technology potential of
32