
Page 59 - Azerbaijan State University of Economics
P. 59
THE JOURNAL OF ECONOMIC SCIENCES: THEORY AND PRACTICE, V.74, # 2, 2017, pp. 51 - 63
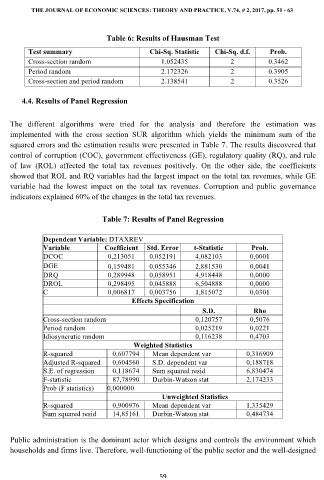
Table 6: Results of Hausman Test
Test summary Chi-Sq. Statistic Chi-Sq. d.f. Prob.
Cross-section random 1.052435 2 0.3462
Period random 2.172326 2 0.3905
Cross-section and period random 2.138541 2 0.3526
4.4. Results of Panel Regression
The different algorithms were tried for the analysis and therefore the estimation was
implemented with the cross section SUR algorithm which yields the minimum sum of the
squared errors and the estimation results were presented in Table 7. The results discovered that
control of corruption (COC), government effectiveness (GE), regulatory quality (RQ), and rule
of law (ROL) affected the total tax revenues positively. On the other side, the coefficients
showed that ROL and RQ variables had the largest impact on the total tax revenues, while GE
variable had the lowest impact on the total tax revenues. Corruption and public governance
indicators explained 60% of the changes in the total tax revenues.
Table 7: Results of Panel Regression
Dependent Variable: DTAXREV
Variable Coefficient Std. Error t-Statistic Prob.
DCOC 0,213051 0,052191 4,082103 0,0001
DGE 0,159481 0,055346 2,881530 0,0041
DRQ 0,289948 0,058951 4,918448 0,0000
DROL 0,298495 0,045888 6,504888 0,0000
C 0,006817 0,003756 1,815072 0,0301
Effects Specification
S.D. Rho
Cross-section random 0,120757 0,5076
Period random 0,025219 0,0221
Idiosyncratic random 0,116238 0,4703
Weighted Statistics
R-squared 0,607794 Mean dependent var 0,316909
Adjusted R-squared 0,604560 S.D. dependent var 0,188718
S.E. of regression 0,118674 Sum squared resid 6,830474
F-statistic 87,78990 Durbin-Watson stat 2,174233
Prob (F statistics) 0,000000
Unweighted Statistics
R-squared 0,900976 Mean dependent var 1,335429
Sum squared resid 14,85161 Durbin-Watson stat 0,484734
Public administration is the dominant actor which designs and controls the environment which
households and firms live. Therefore, well-functioning of the public sector and the well-designed
59