
Page 73 - Azerbaijan State University of Economics
P. 73
THE JOURNAL OF ECONOMIC SCIENCES: THEORY AND PRACTICE, V.80, # 1, 2023, pp. 67-82
According to Table 2, we can say that the KMO value is 0.887 and the significance (sig.)
value is p<0.05. For effective factor analysis, the sampling adequacy value should be 0.6
or higher (Tabachnick and Fidell, 2007). In this way, the research statements seem
suitable for factor analysis. Thus, based on the result of KMO and Bartlett's test, we can
conclude that the research statements are suitable for factor analysis.
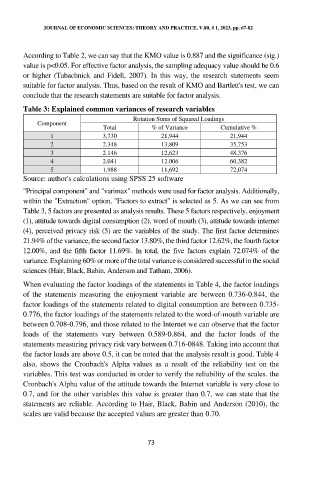
Table 3: Explained common variances of research variables
Rotation Sums of Squared Loadings
Component
Total % of Variance Cumulative %
1 3,730 21,944 21,944
2 2.348 13,809 35,753
3 2.146 12,623 48,376
4 2.041 12.006 60,382
5 1.988 11,692 72,074
Source: author's calculations using SPSS 25 software
"Principal component" and "varimax" methods were used for factor analysis. Additionally,
within the "Extraction" option, "Factors to extract" is selected as 5. As we can see from
Table 3, 5 factors are presented as analysis results. These 5 factors respectively, enjoyment
(1), attitude towards digital consumption (2), word of mouth (3), attitude towards internet
(4), perceived privacy risk (5) are the variables of the study. The first factor determines
21.94% of the variance, the second factor 13.80%, the third factor 12.62%, the fourth factor
12.00%, and the fifth factor 11.69%. In total, the five factors explain 72.074% of the
variance. Explaining 60% or more of the total variance is considered successful in the social
sciences (Hair, Black, Babin, Anderson and Tatham, 2006).
When evaluating the factor loadings of the statements in Table 4, the factor loadings
of the statements measuring the enjoyment variable are between 0.736-0.844, the
factor loadings of the statements related to digital consumption are between 0.735-
0.776, the factor loadings of the statements related to the word-of-mouth variable are
between 0.708-0.796, and those related to the Internet we can observe that the factor
loads of the statements vary between 0.589-0.864, and the factor loads of the
statements measuring privacy risk vary between 0.716-0848. Taking into account that
the factor loads are above 0.5, it can be noted that the analysis result is good. Table 4
also, shows the Cronbach's Alpha values as a result of the reliability test on the
variables. This test was conducted in order to verify the reliability of the scales. the
Cronbach's Alpha value of the attitude towards the Internet variable is very close to
0.7, and for the other variables this value is greater than 0.7, we can state that the
statements are reliable. According to Hair, Black, Babin and Anderson (2010), the
scales are valid because the accepted values are greater than 0.70.
73