
Page 61 - Azerbaijan State University of Economics
P. 61
THE JOURNAL OF ECONOMIC SCIENCES: THEORY AND PRACTICE, V.81, # 1, 2024, pp. 51-64
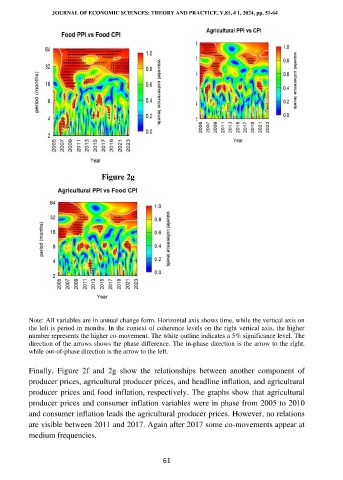
Figure 2g
Note: All variables are in annual change form. Horizontal axis shows time, while the vertical axis on
the left is period in months. In the context of coherence levels on the right vertical axis, the higher
number represents the higher co-movement. The white outline indicates a 5% significance level. The
direction of the arrows shows the phase difference. The in-phase direction is the arrow to the right,
while out-of-phase direction is the arrow to the left.
Finally, Figure 2f and 2g show the relationships between another component of
producer prices, agricultural producer prices, and headline inflation, and agricultural
producer prices and food inflation, respectively. The graphs show that agricultural
producer prices and consumer inflation variables were in phase from 2005 to 2010
and consumer inflation leads the agricultural producer prices. However, no relations
are visible between 2011 and 2017. Again after 2017 some co-movements appear at
medium frequencies.
61