
Page 57 - Azerbaijan State University of Economics
P. 57
Shaig E.Kazimov: More Than Just Unemployment: How the Fear Of Not Finding A Job Shapes Life
Satisfaction In Azerbaijan
• Social impact (SI) (Mediation variable – M2) – “How has unemployment affected
your social relationships and socialization in general?”. Here, the answers are
coded as 1-“Completely improved”, 2-“Partially improved”, 3-“Remained
unchanged”, 4-“Partially worsened” and 5-“Completely worsened”.
• Future hope (FH) (Mediation variable – M3) – “To what extent do you believe that
employment will increase your happiness and life satisfaction?”. Here, the answers
are coded as 1-“Not at all”, 2-“Not much”, 3-“Not sure”, 4-“Somewhat” and 5-“A
great deal”.
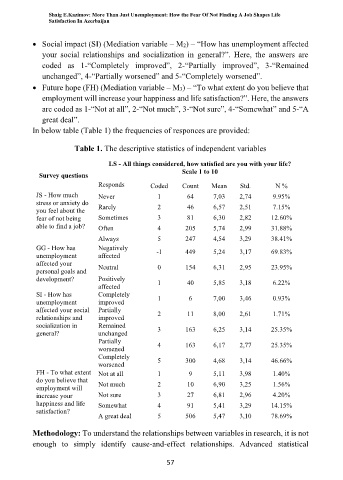
In below table (Table 1) the frequencies of responces are provided:
Table 1. The descriptive statistics of independent variables
LS - All things considered, how satisfied are you with your life?
Scale 1 to 10
Survey questions
Responds Coded Count Mean Std. N %
JS - How much Never 1 64 7,03 2,74 9.95%
stress or anxiety do
you feel about the Rarely 2 46 6,57 2,51 7.15%
fear of not being Sometimes 3 81 6,30 2,82 12.60%
able to find a job? Often 4 205 5,74 2,99 31.88%
Always 5 247 4,54 3,29 38.41%
GG - How has Negatively -1 449 5,24 3,17 69.83%
unemployment affected
affected your Neutral 0 154 6,31 2,95 23.95%
personal goals and
development? Positively 1 40 5,85 3,18 6.22%
affected
SI - How has Completely
unemployment improved 1 6 7,00 3,46 0.93%
affected your social Partially 2 11 8,00 2,61 1.71%
relationships and improved
socialization in Remained 3 163 6,25 3,14 25.35%
general? unchanged
Partially
worsened 4 163 6,17 2,77 25.35%
Completely 5 300 4,68 3,14 46.66%
worsened
FH - To what extent Not at all 1 9 5,11 3,98 1.40%
do you believe that Not much 2 10 6,90 3,25 1.56%
employment will
increase your Not sure 3 27 6,81 2,96 4.20%
happiness and life Somewhat 4 91 5,41 3,29 14.15%
satisfaction?
A great deal 5 506 5,47 3,10 78.69%
Methodology: To understand the relationships between variables in research, it is not
enough to simply identify cause-and-effect relationships. Advanced statistical
57