
Page 66 - Azerbaijan State University of Economics
P. 66
THE JOURNAL OF ECONOMIC SCIENCES: THEORY AND PRACTICE
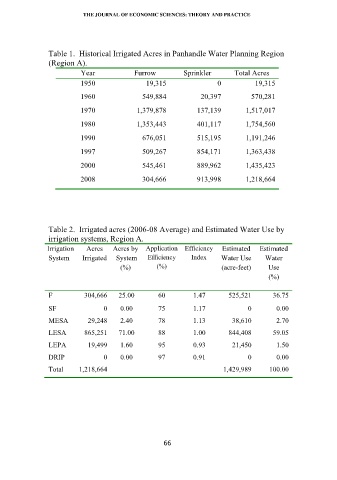
Table 1. Historical Irrigated Acres in Panhandle Water Planning Region
(Region A).
Year Furrow Sprinkler Total Acres
1950 19,315 0 19,315
1960 549,884 20,397 570,281
1970 1,379,878 137,139 1,517,017
1980 1,353,443 401,117 1,754,560
1990 676,051 515,195 1,191,246
1997 509,267 854,171 1,363,438
2000 545,461 889,962 1,435,423
2008 304,666 913,998 1,218,664
Table 2. Irrigated acres (2006-08 Average) and Estimated Water Use by
irrigation systems, Region A.
Irrigation Acres Acres by Application Efficiency Estimated Estimated
System Irrigated System Efficiency Index Water Use Water
(%) (%) (acre-feet) Use
(%)
F 304,666 25.00 60 1.47 525,521 36.75
SF 0 0.00 75 1.17 0 0.00
MESA 29,248 2.40 78 1.13 38,610 2.70
LESA 865,251 71.00 88 1.00 844,408 59.05
LEPA 19,499 1.60 95 0.93 21,450 1.50
DRIP 0 0.00 97 0.91 0 0.00
Total 1,218,664 1,429,989 100.00
66