
Page 52 - Azerbaijan State University of Economics
P. 52
THE JOURNAL OF ECONOMIC SCIENCES: THEORY AND PRACTICE
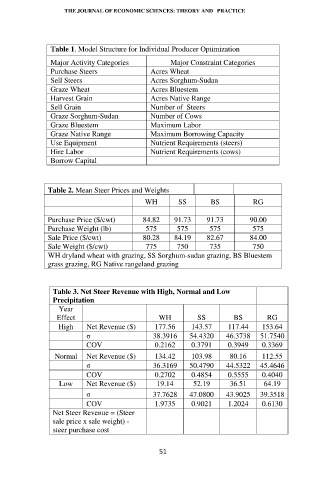
Table 1. Model Structure for Individual Producer Optimization
Major Activity Categories Major Constraint Categories
Purchase Steers Acres Wheat
Sell Steers Acres Sorghum-Sudan
Graze Wheat Acres Bluestem
Harvest Grain Acres Native Range
Sell Grain Number of Steers
Graze Sorghum-Sudan Number of Cows
Graze Bluestem Maximum Labor
Graze Native Range Maximum Borrowing Capacity
Use Equipment Nutrient Requirements (steers)
Hire Labor Nutrient Requirements (cows)
Borrow Capital
Table 2. Mean Steer Prices and Weights
WH SS BS RG
Purchase Price ($/cwt) 84.82 91.73 91.73 90.00
Purchase Weight (lb) 575 575 575 575
Sale Price ($/cwt) 80.28 84.19 82.67 84.00
Sale Weight ($/cwt) 775 750 735 750
WH dryland wheat with grazing, SS Sorghum-sudan grazing, BS Bluestem
grass grazing, RG Native rangeland grazing
Table 3. Net Steer Revenue with High, Normal and Low
Precipitation
Year
Effect WH SS BS RG
High Net Revenue ($) 177.56 143.57 117.44 153.64
σ 38.3916 54.4320 46.3738 51.7540
COV 0.2162 0.3791 0.3949 0.3369
Normal Net Revenue ($) 134.42 103.98 80.16 112.55
σ 36.3169 50.4790 44.5322 45.4646
COV 0.2702 0.4854 0.5555 0.4040
Low Net Revenue ($) 19.14 52.19 36.51 64.19
σ 37.7628 47.0800 43.9025 39.3518
COV 1.9735 0.9021 1.2024 0.6130
Net Steer Revenue = (Steer
sale price x sale weight) -
steer purchase cost
51