Page 53 - Azerbaijan State University of Economics
P. 53

RISK REDUCTION THROUGH OPTIMAL GRAZING SCENARIOS FOR
                                    LIVESTOCK/FORAGE SYSTEMS IN TEXAS PANHANDLE


                    Table 4. Net Returns Reflecting Market Risk and
                    Precipitation Risk, 1992-2009
                                                      WH        SS       BS       RG
                            Net Return ($)          177.56    143.57   117.44    153.64
                                  σ                 38.3916  54.4320  46.3738  51.7540
                                COV                 0.2162    0.3791   0.3949    0.3369
                    Net Return to Land, Labor, and
                    Management


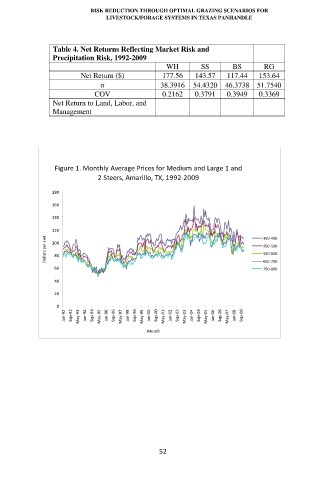
                     Figure 1. Monthly Average Prices for Medium and Large 1 and
                                 2 Steers, Amarillo, TX, 1992-2009

                    180
                    160

                    140
                    120                                                           350-400
                  Dollars per cwt  100                                            450-500

                                                                                  550-600
                     80
                     60                                                           650-700
                                                                                  750-800
                     40

                     20
                     0
                        Jan-92  Sep-92  May-93  Jan-94  Sep-94  May-95  Jan-96  Sep-96  May-97  Jan-98  Sep-98  May-99  Jan-00  Sep-00  May-01  Jan-02  Sep-02  May-03  Jan-04  Sep-04  May-05  Jan-06  Sep-06  May-07  Jan-08  Sep-08


                                                Month


                                                       52
   48   49   50   51   52   53   54   55   56   57   58