
Page 133 - Azerbaijan State University of Economics
P. 133
THE JOURNAL OF ECONOMIC SCIENCES: THEORY AND PRACTICE, V.71, # 1, 2014, pp. 127-139
In a first step the different data sources were identified and structured in a central repository.
Normally – as in this case - there are 5 different kinds of data being integrated in the dataset:
(1) Costdata from common cost tables on wages, (2) treatmentcost and cost of equipment,
(3) Data on Process Work-flows mostly from specific studies (e.g. How long does it take to
perform an ECG?), (4) Data on population epidemiology like incidence and prevalence rates for
targeted illnesses, and last (5) Data on specific effects of the Technology to be investigated in the
simulation.In a second step the data is “normalized”: All input and outcome values are projected
to a similar “normalized” set of parameters. This normalisation process would for example
project different studies comparing the impact of a HF-Monitoring system to the two parameters
“Number of Hospitalisations” and “Length of Stay” with and without the technology and would
make it compareable to other studies dealing with a compareable technology.
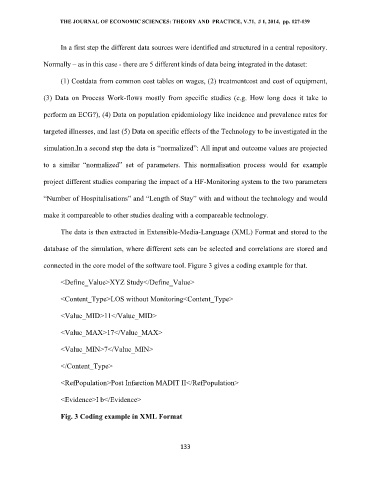
The data is then extracted in Extensible-Media-Language (XML) Format and stored to the
database of the simulation, where different sets can be selected and correlations are stored and
connected in the core model of the software tool. Figure 3 gives a coding example for that.
<Define_Value>XYZ Study</Define_Value>
<Content_Type>LOS without Monitoring<Content_Type>
<Value_MID>11</Value_MID>
<Value_MAX>17</Value_MAX>
<Value_MIN>7</Value_MIN>
</Content_Type>
<RefPopulation>Post Infarction MADIT II</RefPopulation>
<Evidence>I b</Evidence>
Fig. 3 Coding example in XML Format
133