
Page 18 - Azerbaijan State University of Economics
P. 18
THE JOURNAL OF ECONOMIC SCIENCES: THEORY AND PRACTICE, V.72, # 2, 2015, pp. 4-23
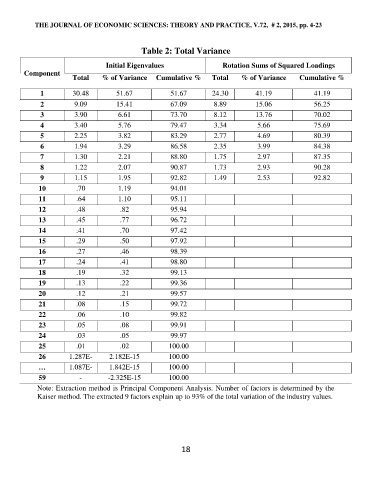
Table 2: Total Variance
Initial Eigenvalues Rotation Sums of Squared Loadings
Component
Total % of Variance Cumulative % Total % of Variance Cumulative %
1 30.48 51.67 51.67 24.30 41.19 41.19
2 9.09 15.41 67.09 8.89 15.06 56.25
3 3.90 6.61 73.70 8.12 13.76 70.02
4 3.40 5.76 79.47 3.34 5.66 75.69
5 2.25 3.82 83.29 2.77 4.69 80.39
6 1.94 3.29 86.58 2.35 3.99 84.38
7 1.30 2.21 88.80 1.75 2.97 87.35
8 1.22 2.07 90.87 1.73 2.93 90.28
9 1.15 1.95 92.82 1.49 2.53 92.82
10 .70 1.19 94.01
11 .64 1.10 95.11
12 .48 .82 95.94
13 .45 .77 96.72
14 .41 .70 97.42
15 .29 .50 97.92
16 .27 .46 98.39
17 .24 .41 98.80
18 .19 .32 99.13
19 .13 .22 99.36
20 .12 .21 99.57
21 .08 .15 99.72
22 .06 .10 99.82
23 .05 .08 99.91
24 .03 .05 99.97
25 .01 .02 100.00
26 1.287E- 2.182E-15 100.00
15
… 1.087E- 1.842E-15 100.00
-
59 15 -2.325E-15 100.00
1.372E-
Note: Extraction method is Principal Component Analysis. Number of factors is determined by the
15
Kaiser method. The extracted 9 factors explain up to 93% of the total variation of the industry values.
18