Page 21 - Azerbaijan State University of Economics
P. 21

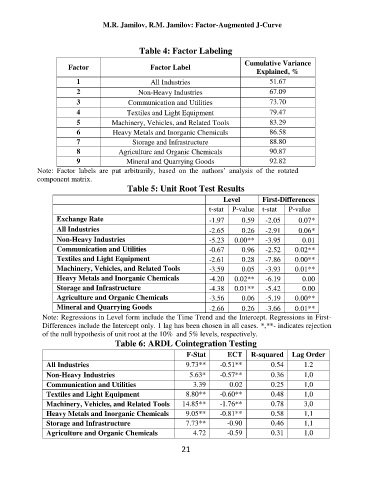
M.R. Jamilov, R.M. Jamilov: Factor-Augmented J-Curve


                                                Table 4: Factor Labeling
                                                                             Cumulative Variance
                            Factor                 Factor Label
                                                                                Explained, %
                               1                   All Industries                   51.67
                               2               Non-Heavy Industries                 67.09
                               3             Communication and Utilities            73.70
                               4            Textiles and Light Equipment            79.47
                               5        Machinery, Vehicles, and Related Tools      83.29
                               6        Heavy Metals and Inorganic Chemicals        86.58
                               7              Storage and Infrastructure            88.80
                               8          Agriculture and Organic Chemicals         90.87
                               9            Mineral and Quarrying Goods             92.82
                    Note:  Factor  labels  are  put  arbitrarily,  based  on  the  authors‟  analysis  of  the  rotated
                    component matrix.
                                            Table 5: Unit Root Test Results

                                                                       Level      First-Differences
                                                                   t-stat  P-value  t-stat   P-value
                         Exchange Rate                             -1.97    0.59   -2.05   0.07*
                         All Industries                            -2.65    0.26   -2.91   0.06*
                         Non-Heavy Industries                      -5.23   0.00**   -3.95    0.01
                         Communication and Utilities               -0.67    0.96   -2.52   0.02**
                         Textiles and Light Equipment              -2.61    0.28   -7.86   0.00**
                         Machinery, Vehicles, and Related Tools    -3.59    0.05   -3.93   0.01**
                         Heavy Metals and Inorganic Chemicals      -4.20   0.02**   -6.19    0.00
                         Storage and Infrastructure                -4.38   0.01**   -5.42    0.00
                         Agriculture and Organic Chemicals         -3.56    0.06   -5.19   0.00**
                         Mineral and Quarrying Goods               -2.66    0.26   -3.66   0.01**
                     Note: Regressions in Level form include the Time Trend and the Intercept. Regressions in First-
                     Differences include the Intercept only. 1 lag has been chosen in all cases. *,**- indicates rejection
                     of the null hypothesis of unit root at the 10%  and 5% levels, respectively.
                                         Table 6: ARDL Cointegration Testing
                                                             F-Stat     ECT  R-squared  Lag Order
                      All Industries                         9.73**   -0.51**       0.54     1.2
                      Non-Heavy Industries                    5.63*   -0.57**       0.36     1,0
                      Communication and Utilities              3.39      0.02       0.25     1,0
                      Textiles and Light Equipment           8.80**   -0.60**       0.48     1,0
                      Machinery, Vehicles, and Related Tools   14.85**   -1.76**    0.78     3,0
                      Heavy Metals and Inorganic Chemicals   9.05**   -0.81**       0.58     1,1
                      Storage and Infrastructure             7.73**     -0.90       0.46     1,1
                      Agriculture and Organic Chemicals        4.72     -0.59       0.31     1,0

                                                           21
   16   17   18   19   20   21   22   23   24   25   26