
Page 83 - Azerbaijan State University of Economics
P. 83
THE JOURNAL OF ECONOMIC SCIENCES: THEORY AND PRACTICE, V.72, # 2, 2015, pp. 73-86
THE JOURNAL OF ECONOMIC SCIENCES: THEORY AND PRACTICE, V.72, # 2, 2015, pp. 73-86
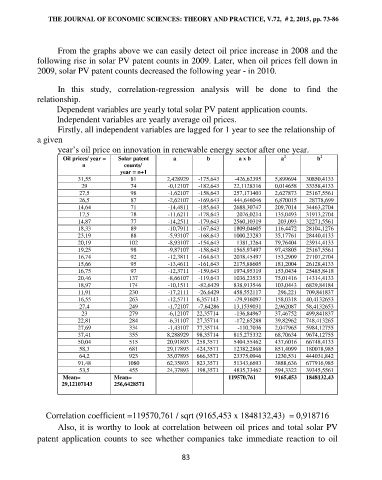
From the graphs above we can easily detect oil price increase in 2008 and the
following rise in solar PV patent counts in 2009. Later, when oil prices fell down in
2009, solar PV patent counts decreased the following year - in 2010.
In this study, correlation-regression analysis will be done to find the
relationship.
Dependent variables are yearly total solar PV patent application counts.
Independent variables are yearly average oil prices.
Firstly, all independent variables are lagged for 1 year to see the relationship of
a given
year‟s oil price on innovation in renewable energy sector after one year.
Oil prices/ year = Solar patent a b a x b a 2 b 2
n counts/
year = n+1
31,55 81 2,428929 -175,643 -426,62395 5,899694 30850,4133
29 74 -0,12107 -182,643 22,1128316 0,014658 33358,4133
27,5 98 -1,62107 -158,643 257,171403 2,627873 25167,5561
26,5 87 -2,62107 -169,643 444,646046 6,870015 28778,699
14,64 71 -14,4811 -185,643 2688,30747 209,7014 34463,2704
17,5 78 -11,6211 -178,643 2076,0214 135,0493 31913,2704
14,87 77 -14,2511 -179,643 2560,10319 203,093 32271,5561
18,33 89 -10,7911 -167,643 1809,04605 116,4472 28104,1276
23,19 88 -5,93107 -168,643 1000,23283 35,17761 28440,4133
20,19 102 -8,93107 -154,643 1381,1264 79,76404 23914,4133
19,25 98 -9,87107 -158,643 1565,97497 97,43805 25167,5561
16,74 92 -12,3811 -164,643 2038,45497 153,2909 27107,2704
15,66 95 -13,4611 -161,643 2175,88605 181,2004 26128,4133
16,75 97 -12,3711 -159,643 1974,95319 153,0434 25485,8418
20,46 137 -8,66107 -119,643 1036,23533 75,01416 14314,4133
18,97 174 -10,1511 -82,6429 838,913546 103,0443 6829,84184
11,91 230 -17,2111 -26,6429 458,552117 296,221 709,841837
16,55 263 -12,5711 6,357143 -79,916097 158,0318 40,4132653
27,4 249 -1,72107 -7,64286 13,1539031 2,962087 58,4132653
23 279 -6,12107 22,35714 -136,84967 37,46752 499,841837
22,81 284 -6,31107 27,35714 -172,65288 39,82962 748,413265
27,69 334 -1,43107 77,35714 -110,7036 2,047965 5984,12755
37,41 355 8,288929 98,35714 815,275332 68,70634 9674,12755
50,04 515 20,91893 258,3571 5404,55462 437,6016 66748,4133
58,3 681 29,17893 424,3571 12382,2868 851,4099 180078,985
64,2 923 35,07893 666,3571 23375,0946 1230,531 444031,842
91,48 1080 62,35893 823,3571 51343,6693 3888,636 677916,985
53,5 455 24,37893 198,3571 4835,73462 594,3322 39345,5561
Mean= Mean= 119570,761 9165,453 1848132,43
29,12107143 256,6428571
Correlation coefficient =119570,761 / sqrt (9165,453 x 1848132,43) = 0,918716
Also, it is worthy to look at correlation between oil prices and total solar PV
patent application counts to see whether companies take immediate reaction to oil
83