
Page 21 - Azerbaijan State University of Economics
P. 21
N.Akimov., S.Baizakov., A. Oinarov., E.Utembayev: The analysis of the macroeconomic
dynamics and assessment of smart factors’ inputs to the balanced growth rates
decreases in accordance with the following formula: The share
in subset I increases, accordingly, as in formula:
When the materials intensity decreases ( <0) the changes tend to move in
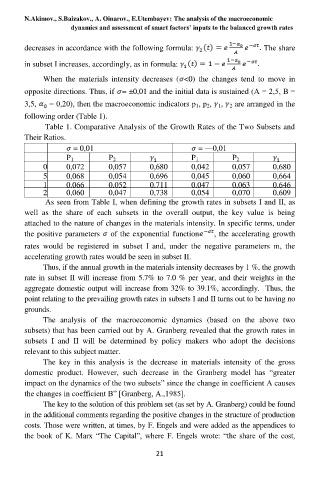
opposite directions. Thus, if = ±0,01 and the initial data is sustained (А = 2,5, В =
3,5, = 0,20), then the macroeconomic indicators р 1, р 2, 1, 2 are arranged in the
following order (Table 1).
Table 1. Comparative Analysis of the Growth Rates of the Two Subsets and
Their Ratios.
= 0,01 = —0,01
P 1 P 2 P 1 P 2
0 0,072 0,057 0,680 0,042 0,057 0,680
5 0,068 0,054 0,696 0,045 0,060 0,664
1 0,066 0,052 0,711 0,047 0,063 0,646
0 2 0,060 0,047 0,738 0,054 0,070 0,609
0 As seen from Table I, when defining the growth rates in subsets I and II, as
well as the share of each subsets in the overall output, the key value is being
attached to the nature of changes in the materials intensity. In specific terms, under
the positive parameters of the exponential function , the accelerating growth
rates would be registered in subset I and, under the negative parameters m, the
accelerating growth rates would be seen in subset II.
Thus, if the annual growth in the materials intensity decreases by 1 %, the growth
rate in subset II will increase from 5.7% to 7.0 % per year, and their weights in the
aggregate domestic output will increase from 32% to 39.1%, accordingly. Thus, the
point relating to the prevailing growth rates in subsets I and II turns out to be having no
grounds.
The analysis of the macroeconomic dynamics (based on the above two
subsets) that has been carried out by A. Granberg revealed that the growth rates in
subsets I and II will be determined by policy makers who adopt the decisions
relevant to this subject matter.
The key in this analysis is the decrease in materials intensity of the gross
domestic product. However, such decrease in the Granberg model has ―greater
impact on the dynamics of the two subsets‖ since the change in coefficient A causes
the changes in coefficient B‖ [Granberg, A.,1985].
The key to the solution of this problem set (as set by A. Granberg) could be found
in the additional comments regarding the positive changes in the structure of production
costs. Those were written, at times, by F. Engels and were added as the appendices to
the book of K. Marx ―The Capital‖, where F. Engels wrote: ―the share of the cost,
21