
Page 16 - Azerbaijan State University of Economics
P. 16
THE JOURNAL OF ECONOMIC SCIENCES: THEORY AND PRACTICE, V.74, # 2, 2017, pp. 4-31
functions. These all have been articulated and solved, simultaneously and in an integral manner,
using available, rudimentary and simulated statistical data, for the Somali economy.
Real GDP and Per-Capita Income Growth Trajectories
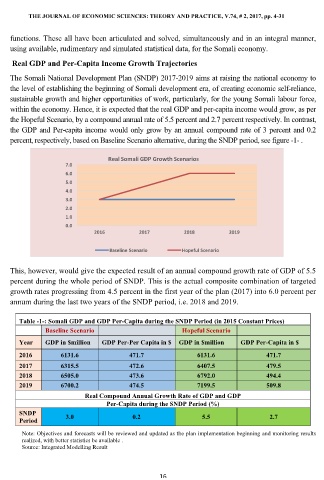
The Somali National Development Plan (SNDP) 2017-2019 aims at raising the national economy to
the level of establishing the beginning of Somali development era, of creating economic self-reliance,
sustainable growth and higher opportunities of work, particularly, for the young Somali labour force,
within the economy. Hence, it is expected that the real GDP and per-capita income would grow, as per
the Hopeful Scenario, by a compound annual rate of 5.5 percent and 2.7 percent respectively. In contrast,
the GDP and Per-capita income would only grow by an annual compound rate of 3 percent and 0.2
percent, respectively, based on Baseline Scenario alternative, during the SNDP period, see figure -1- .
Real Somali GDP Growth Scenarios
7.0
6.0
5.0
4.0
3.0
2.0
1.0
0.0
2016 2017 2018 2019
Baseline Scenario Hopeful Scenario
This, however, would give the expected result of an annual compound growth rate of GDP of 5.5
percent during the whole period of SNDP. This is the actual composite combination of targeted
growth rates progressing from 4.5 percent in the first year of the plan (2017) into 6.0 percent per
annum during the last two years of the SNDP period, i.e. 2018 and 2019.
Table -1-: Somali GDP and GDP Per-Capita during the SNDP Period (in 2015 Constant Prices)
Baseline Scenario Hopeful Scenario
Year GDP in $million GDP Per-Per Capita in $ GDP in $million GDP Per-Capita in $
2016 6131.6 471.7 6131.6 471.7
2017 6315.5 472.6 6407.5 479.5
2018 6505.0 473.6 6792.0 494.4
2019 6700.2 474.5 7199.5 509.8
Real Compound Annual Growth Rate of GDP and GDP
Per-Capita during the SNDP Period (%)
SNDP 3.0 0.2 5.5 2.7
Period
Note: Objectives and forecasts will be reviewed and updated as the plan implementation beginning and monitoring results
realized, with better statistics be available .
Source: Integrated Modelling Result
16