
Page 21 - Azerbaijan State University of Economics
P. 21
Hashim Al-Ali: Towards a realistic medium term macroeconomic and fiscal framework and
outlook for the Somali national economy (2017- 2019)
likely contributions of the main sectors of the Somali economy to GDP, and each of these sectors
resulting compound real annual rate of growth, applying both assumed growth scenarios of GDP,
i.e. the Baseline and the Hopeful Scenario, during the period 2016 to 2019.
Table -3- The Planned Structure of the Somali Economy during the SNDP Period
Baseline Scenario Hopeful Scenario
Percentage Annual Percentage Annual
Sectoral Clustering Share of the Growth Sectoral Clustering Share of the Growth
GDP Rate (%) GDP Rate (%)
2016 2019 (2017-2019) 2016 2019 2017-2019)
Productive Sector 63.8 62.1 2.1 Productive Sector 63.8 62.1 4.6
Infrastructure Infrastructure
Sector 4.2 7.2 23.3 Sector 4.2 7.2 26.2
Social and Other 32.0 30.7 1.6 Social and Other 32.0 30.7
Services Sector Services Sector 4.1
Total (GDP) 100 100 3.0 Total (GDP) 100 100 5.5
Source: Integrated Macro Modelling Results
Besides, the trade and financial services sectors are expected to play a leading role in economic
development and in creating jobs. These sectors would be taking advantage of the opportunities
offered through and by developing the road, port, communication, utilities sectors and activities
within the national economy during the SNDP period. Within this assuming sectoral setting, the
mining and tourism sectors are expected to be developed further, improved and emerged as
among the key sectors in the economy, given the favorable location and subject to improved
security situation of the Somalia.
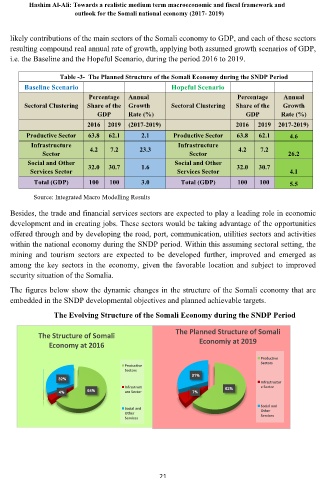
The figures below show the dynamic changes in the structure of the Somali economy that are
embedded in the SNDP developmental objectives and planned achievable targets.
The Evolving Structure of the Somali Economy during the SNDP Period
The Planned Structure of Somali
The Structure of Somali
Economy at 2016 Economiy at 2019
Productive
Productive Sectors
Sectors
32% 31%
Infrastruct Infrastructur
e Sector
4% 64% ure Sector 7% 62%
Social and Social and
Other
Other Services
Services
21