
Page 56 - Azerbaijan State University of Economics
P. 56
THE JOURNAL OF ECONOMIC SCIENCES: THEORY AND PRACTICE, V.76, # 1, 2019, pp. 48-69
In order to determine which model to use in the effect size calculation based on the
relationship between school effectiveness and school climate, homogeneity test was
2
done and I statistics were calculated. The results are given in the table below.
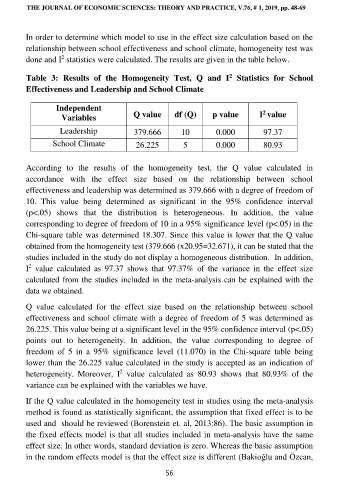
Table 3: Results of the Homogeneity Test, Q and I Statistics for School
2
Effectiveness and Leadership and School Climate
Independent 2
Variables Q value df (Q) p value I value
Leadership 379.666 10 0.000 97.37
School Climate 26.225 5 0.000 80.93
According to the results of the homogeneity test, the Q value calculated in
/////VvVariablesVariable
accordance with the effect size based on the relationship between school
effectiveness and leadership was determined as 379.666 with a degree of freedom of
10. This value being determined as significant in the 95% confidence interval
(p<.05) shows that the distribution is heterogeneous. In addition, the value
corresponding to degree of freedom of 10 in a 95% significance level (p<.05) in the
Chi-square table was determined 18.307. Since this value is lower that the Q value
obtained from the homogeneity test (379.666 (x20.95=32.671), it can be stated that the
studies included in the study do not display a homogeneous distribution. In addition,
2
I value calculated as 97.37 shows that 97.37% of the variance in the effect size
calculated from the studies included in the meta-analysis can be explained with the
data we obtained.
Q value calculated for the effect size based on the relationship between school
effectiveness and school climate with a degree of freedom of 5 was determined as
26.225. This value being at a significant level in the 95% confidence interval (p<.05)
points out to heterogeneity. In addition, the value corresponding to degree of
freedom of 5 in a 95% significance level (11.070) in the Chi-square table being
lower than the 26.225 value calculated in the study is accepted as an indication of
2
heterogeneity. Moreover, I value calculated as 80.93 shows that 80.93% of the
variance can be explained with the variables we have.
If the Q value calculated in the homogeneity test in studies using the meta-analysis
method is found as statistically significant, the assumption that fixed effect is to be
used and should be reviewed (Borenstein et. al, 2013:86). The basic assumption in
the fixed effects model is that all studies included in meta-analysis have the same
effect size. In other words, standard deviation is zero. Whereas the basic assumption
in the random effects model is that the effect size is different (Bakioğlu and Özcan,
56