
Page 57 - Azerbaijan State University of Economics
P. 57
Ercan Yılmaz, Gulnar Jafarova: Leadership and School Climate in Effective Schools: A Meta-
Analysis
2016:165). In the light of this information and data, it was decided to calculate effect
size based on the relationship between school effectiveness and leadership according
to the random effects model. Effect size calculations based on this, the forest graph
and moderator and publica tion partiality analyses are given below.
Table 4: Finding Related to Effect Size between School Effectiveness and
Leadership and School Climate according to the Random Effects Model
95 % Confidence
Variance Z Effect Size Z P
Independent Interval for Fisher’s
k
∑N
R
Zr
Variable Lower Upper
Limit Limit
Leadership 11 0.534 0.595 5405 0.007 0.428 0.763 6.961 0.000
School climate 6 0.507 0.559 1928 0.004 0.429 0.690 8.404 0.000
The Fisher’s Z effect size based on the relationship between school effectiveness
and leadership was calculated as 0.595. When the table is analyzed, it can be seen
that there is a positive and significant level (p<.05) of effect size between school
effectiveness and leadership.
The effect size calculated based on the relationship between school effectiveness and
school climate was determined as 0.559. When Table 4 is analyzed, it can be seen
that the effect size is at a positive, strong and significant level (p<.05). the forest
graphs created in line with these data are given below.
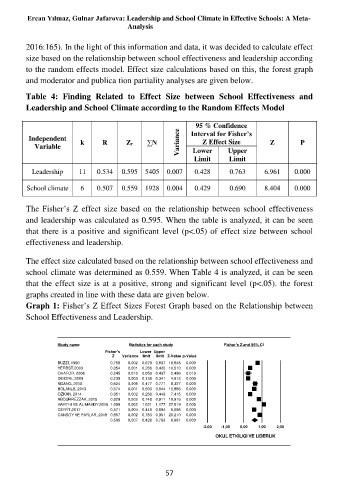
Graph 1: Fisher’s Z Effect Sizes Forest Graph based on the Relationship between
School Effectiveness and Leadership.
Study name Statistics for each study Fisher's Z and 95% CI
Fisher's Lower Upper
Z Variance limit limit Z-Value p-Value
BUZZI, 1990 0,758 0,002 0,679 0,837 18,848 0,000
0,354
0,001
0,288 0,420 10,510
HERBST,2003
0,000
OKAFOR, 2006 0,245 0,010 0,053 0,437 2,496 0,013
DEIDRE, 2009 0,239 0,003 0,138 0,341 4,613 0,000
NGANG, 2010 0,624 0,006 0,477 0,771 8,327 0,000
0,000
0,503 0,644 15,886
0,001
0,574
BOLANLE, 2013
OZKAN, 2014 0,351 0,002 0,258 0,443 7,415 0,000
ABDURREZZAK, 2015 0,829 0,002 0,748 0,911 19,916 0,000
HARTHI VE AL-MAHDY,2016 1,099 0,002 1,021 1,177 27,619 0,000
CERÝT,2017 0,571 0,004 0,448 0,694 9,098 0,000
CANSOY VE PARLAR, 2018 0,867 0,002 0,783 0,951 20,210 0,000
0,595 0,007 0,428 0,763 6,961 0,000
-2,00 -1,00 0,00 1,00 2,00
OKUL ETKILIGI VE LIDERLIK
57