
Page 52 - Azerbaijan State University of Economics
P. 52
Mbu Daniel Tambi , Peter Arung Etat: Implications of Access to Portable Water
For Child Health Production in Cameroon
5. EXPECTED RESULTS
5.1 Weighted Sample Descriptive Statistics
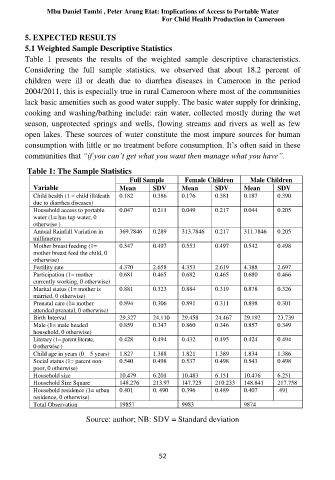
Table 1 presents the results of the weighted sample descriptive characteristics.
Considering the full sample statistics, we observed that about 18.2 percent of
children were ill or death due to diarrhea diseases in Cameroon in the period
2004/2011, this is especially true in rural Cameroon where most of the communities
lack basic amenities such as good water supply. The basic water supply for drinking,
cooking and washing/bathing include: rain water, collected mostly during the wet
season, unprotected springs and wells, flowing streams and rivers as well as few
open lakes. These sources of water constitute the most impure sources for human
consumption with little or no treatment before consumption. It’s often said in these
communities that “if you can’t get what you want then manage what you have”.
Table 1: The Sample Statistics
Full Sample Female Children Male Children
Variable Mean SDV Mean SDV Mean SDV
Child health (1 = child ill/death 0.182 0.386 0.176 0.381 0.187 0.390
due to diarrhea diseases)
Household access to portable 0.047 0.211 0.049 0.217 0.044 0.205
water (1= has tap water, 0
otherwise )
Annual Rainfall Variation in 369.7846 0.289 313.7846 0.217 311.7846 0.205
millimeters
Mother breast feeding (1= 0.547 0.497 0.553 0.497 0.542 0.498
mother breast feed the child, 0
otherwise)
Fertility rate 4.370 2.658 4.353 2.619 4.388 2.697
Participation (1= mother 0.681 0.465 0.682 0.465 0.680 0.466
currently working, 0 otherwise)
Marital status (1= mother is 0.881 0.323 0.884 0.319 0.878 0.326
married, 0 otherwise)
Prenatal care (1= mother 0.894 0.306 0.891 0.311 0.898 0.301
attended prenatal, 0 otherwise)
Birth Interval 29.327 24.110 29.458 24.467 29.192 23.739
Male (1= male headed 0.859 0.347 0.860 0.346 0.857 0.349
household, 0 otherwise)
Literacy (1= parent literate, 0.428 0.494 0.432 0.495 0.424 0.494
0 otherwise )
Child age in years (0 – 5 years) 1.827 1.388 1.821 1.389 1.834 1.386
Social status (1= parent non- 0.540 0.498 0.537 0.498 0.543 0.498
poor, 0 otherwise)
Household size 10.479 6.201 10.483 6.151 10.476 6.251
Household Size Square 148.276 213.97 147.725 210.233 148.841 217.758
Household residence (1= urban 0.401 0. 490 0.396 0.489 0.407 .491
residence, 0 otherwise)
Total Observation 19857 9983 9874
Source: author; NB: SDV = Standard deviation
52