Page 55 - Azerbaijan State University of Economics
P. 55

THE JOURNAL OF ECONOMIC SCIENCES: THEORY AND PRACTICE, V.78, # 2, 2021, pp. 43-62


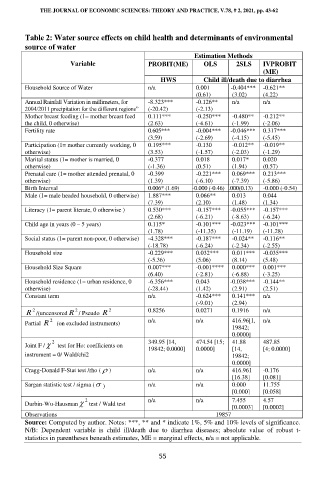
                    Table 2: Water source effects on child health and determinants of environmental
                    source of water
                                                                      Estimation Methods
                                 Variable               PROBIT(ME)       OLS      2SLS    IVPROBIT
                                                                                          (ME)
                                                            HWS          Child ill/death due to diarrhea
                    Household Source of Water           n/a           0.001      -0.404***  -0.621**
                                                                      (0.61)     (3.02)   (4.22)
                    Annual Rainfall Variation in millimeters, for   -8.323***   -0.126**   n/a   n/a
                    2004/2011 precipitation for the different regions”   (-20.42)   (-2.13)
                    Mother breast feeding (1= mother breast feed   0.111***   -0.250***   -0.480**   -0.212**
                    the child, 0 otherwise)             (2.63)        (-4.61)    (-1.99)   (-2.06)
                    Fertility rate                      0.605***      -0.004***   -0.046***   0.317***
                                                        (3.59)        (-2.69)    (-4.15)   (-5.45)
                    Participation (1= mother currently working, 0   0.195***   -0.130   -0.012**   -0.019**
                    otherwise)                          (3.53)        (-1.57)    (-2.03)   (-1.29)
                    Marital status (1= mother is married, 0   -0.377   0.018     0.017*   0.020
                    otherwise)                          (-1.36)       (0.51)     (1.94)   (0.57)
                    Prenatal care (1= mother attended prenatal, 0   -0.399   -0.221***   0.069***   0.213***
                    otherwise)                          (1.39)        (-6.10)    (-7.39)   (-5.86)
                    Birth Interval                      0.006* (1.69)   -0.000 (-0.46) 0.000(0.13)   -0.000 (-0.54)
                    Male (1= male headed household, 0 otherwise)   1.887***   0.066**   0.013   0.044
                                                        (7.39)        (2.10)     (1.48)   (1.34)
                    Literacy (1= parent literate, 0 otherwise )   0.530***   -0.157***   -0.055***   -0.157***
                                                        (2.68)        (-6.21)    (-8.63)   (-6.24)
                    Child age in years (0 – 5 years)    0.115*        -0.101***   -0.023***   -0.101***
                                                        (1.78)        (-11.35)   (-11.19)   (-11.28)
                    Social status (1= parent non-poor, 0 otherwise)   -4.328***   -0.187***   -0.024**   -0.116**
                                                        (-18.78)      (-6.24)    (-2.34)   (-2.55)
                    Household size                      -0.229***     0.032***   0.011***   -0.035***
                                                        (-5.36)       (5.06)     (8.14)   (5.48)
                    Household Size Square               0.007***      -0.001****   0.000***   0.001***
                                                        (6.40)        (-2.81)    (-6.88)   (-3.25)
                    Household residence (1= urban residence, 0   -6.356***   0.043   -0.038***   -0.144**
                    otherwise)                          (-28.44)      (1.42)     (2.91)   (2.51)
                    Constant term                       n/a           -0.624***   0.141***   n/a
                                                                      (-9.01)    (2.94)
                                   2
                                             2
                      2
                    R /(uncensored R / Pseudo  R        0.8256        0.0271     0.1916   n/a
                           2
                    Partial  R   (on excluded instruments)   n/a      n/a        416.96[1,   n/a
                                                                                 19842;
                                                                                 0.0000]
                            2                           349.95 [14,   474.54 [15;   41.88   487.85
                    Joint F /   test for Ho: coefficients on
                                                        19842; 0.0000]   0.0000]   [14,   [4; 0.0000]
                    instrument = 0/ Wald/chi2                                    19842;
                                                                                 0.0000]
                    Cragg-Donald F-Stat test /rho (  )   n/a         n/a        416.961   -0.176
                                                                                 [16.38]   [0.081]
                    Sargan statistic test / sigma ( )    n/a         n/a        0.000    11.755
                                                                                 [0.000]   [0.058]
                                      2                 n/a           n/a        7.455    4.57
                    Durbin-Wu-Hausman  test / Wald test
                                                                                 [0.0003]   [0.0002]
                    Observations                                            19857
                    Source: Computed by author. Notes: ***, ** and * indicate 1%, 5% and 10% levels of significance.
                    N/B:  Dependent  variable  is  child  ill/death  due  to  diarrhea  diseases;  absolute  value  of  robust  t-
                    statistics in parentheses beneath estimates, ME = marginal effects, n/a = not applicable.

                                                           55
   50   51   52   53   54   55   56   57   58   59   60