
Page 58 - Azerbaijan State University of Economics
P. 58
Mbu Daniel Tambi , Peter Arung Etat: Implications of Access to Portable Water
For Child Health Production in Cameroon
The rural women in Cameroon have been noted of extending the breast feeding of
their children to one year and below. Even those children whose parents attempt to
give them water, it’s usually treated water. Many hospitals have taken upon
themselves to advise the mothers on the importance of water to the health of their
children. Factors associated child health at age zero includes: the breast feeding
mother, birth interval, male household head, parent social status and the literacy rate
of parents. In the other hand the factors associated with child age one include the
following: breast feeding mothers, fertility rate, prenatal care, birth interval,
household size, social status and mothers currently working.
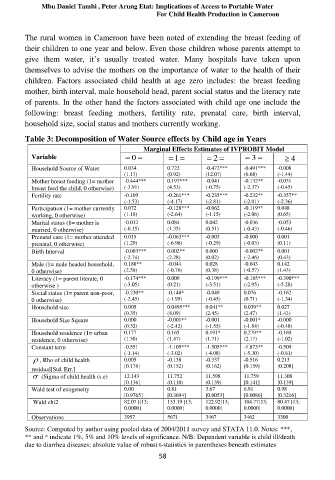
Table 3: Decomposition of Water Source effects by Child age in Years
Marginal Effects Estimates of IVPROBIT Model
Variable = 0 = =1 = = 2 = = 3 = 4
Household Source of Water 0.034 0.722 -0.472*** -0.491*** -0.008
(1.17) (0.92) (12.07) (6.68) (-1.44)
Mother breast feeding (1= mother -0.444*** 0.197*** -0.041 -0.132** -0.031
breast feed the child, 0 otherwise) (-3.91) (4.53) (-0.75) (-2.37) (-0.45)
Fertility rate -0.109 -0.261*** -0.235*** -0.232** -0.357**
(-1.53) (-4.17) (-2.81) (-2.01) (-2.36)
Participation (1= mother currently 0.072 -0.128*** -0.062 -0.119** 0.048
working, 0 otherwise) (1.18) (-2.64) (-1.15) (-2.06) (0.65)
Marital status (1= mother is -0.012 0.084 0.042 -0.036 -0.053
married, 0 otherwise) (-0.15) (1.35) (0.51) (-0.43) (-0.46)
Prenatal care (1= mother attended 0.015 -0.063*** -0.003 -0.000 0.001
prenatal, 0 otherwise) (1.29) (-6.96) (-0.29) (-0.03) (0.11)
Birth Interval -0.003*** 0.002** 0.000 -0.002** 0.001
(-2.74) (2.28) (0.02) (-2.46) (0.43)
Male (1= male headed household, 0.188** -0.044 0.028 -0.043 0.142
0 otherwise) (2.58) (-0.76) (0.38) (-0.57) (1.43)
Literacy (1= parent literate, 0 -0.174*** 0.009 -0.199*** -0.185*** -0.390***
otherwise ) (-3.05) (0.21) (-3.51) (-2.95) (-5.28)
Social status (1= parent non-poor, -0.230** -0.148* -0.049 0.076 -0.162
0 otherwise) (-2.45) (-1.95) (-0.45) (0.71) (-1.34)
Household size 0.005 0.0495*** 0.041** 0.039** 0.027
(0.35) (4.09) (2.45) (2.47) (1.43)
Household Size Square 0.000 -0.001** -0.001 -0.001* -0.000
(0.32) (-2.42) (-1.55) (-1.84) (-0.48)
Household residence (1= urban 0.177 0.165 0.191* 0.279** -0.169
residence, 0 otherwise) (1.50) (1.47) (1.71) (2.17) (-1.02)
Constant term -0.551 -1.105*** -1.505*** -1.873** -0.509
(-1.14) (-3.02) (-4.08) (-5.30) (-0.81)
, Rho of child health 0.005 -0.138 -0.337 -0.516 0.213
[0.178] (0.152) (0.162) [0.159] [0.208]
residual[Std. Err.]
(Sigma of child health (s.e) 12.143 11.752 11.598 11.759 11.308
[0.136] (0.110) (0.139) [0.141] [0.139]
Wald test of exogeneity 0.00 0.81 3.67 6.91 0.98
[0.9765] [0.3694] [0.0053] [0.0086] [0.3216]
Wald chi2 82.07 [(13; 153.19 [13; 122.92[13; 104.77[13; 80.47 [13;
0.0000] 0.0000] 0.0000] 0.0000] 0.0000]
Observations 3957 5671 3467 3462 3300
Source: Computed by author using pooled data of 2004/2011 survey and STATA 11.0. Notes: ***,
** and * indicate 1%, 5% and 10% levels of significance. N/B: Dependent variable is child ill/death
due to diarrhea diseases; absolute value of robust t-statistics in parentheses beneath estimates
58