
Page 7 - Azerbaijan State University of Economics
P. 7
Yadulla Hasanli, Nazim Hajiyev, Gunay Rahimli:Distribution and Analysis of Admission
Scores (In the Case of Azerbaijan
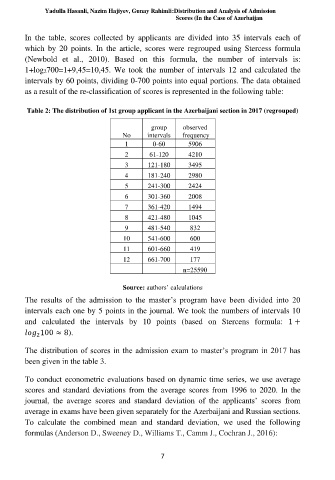
In the table, scores collected by applicants are divided into 35 intervals each of
which by 20 points. In the article, scores were regrouped using Stercess formula
(Newbold et al., 2010). Based on this formula, the number of intervals is:
1+log2700=1+9,45=10,45. We took the number of intervals 12 and calculated the
intervals by 60 points, dividing 0-700 points into equal portions. The data obtained
as a result of the re-classification of scores is represented in the following table:
Table 2: The distribution of 1st group applicant in the Azerbaijani section in 2017 (regrouped)
group observed
No intervals frequency
1 0-60 5906
2 61-120 4210
3 121-180 3495
4 181-240 2980
5 241-300 2424
6 301-360 2008
7 361-420 1494
8 421-480 1045
9 481-540 832
10 541-600 600
11 601-660 419
12 661-700 177
n=25590
Source: authors’ calculations
The results of the admission to the master’s program have been divided into 20
intervals each one by 5 points in the journal. We took the numbers of intervals 10
and calculated the intervals by 10 points (based on Stercens formula: 1 +
100 ≈ 8).
2
The distribution of scores in the admission exam to master’s program in 2017 has
been given in the table 3.
To conduct econometric evaluations based on dynamic time series, we use average
scores and standard deviations from the average scores from 1996 to 2020. In the
journal, the average scores and standard deviation of the applicants’ scores from
average in exams have been given separately for the Azerbaijani and Russian sections.
To calculate the combined mean and standard deviation, we used the following
formulas (Anderson D., Sweeney D., Williams T., Camm J., Cochran J., 2016):
7