
Page 23 - Azerbaijan State University of Economics
P. 23
Aimene Farid, Bahi Nawel:Operational Risk Estimation Using the Value-at-Risk (VAR)
Method: Case Study of the External Bank of Algeria (EBA)
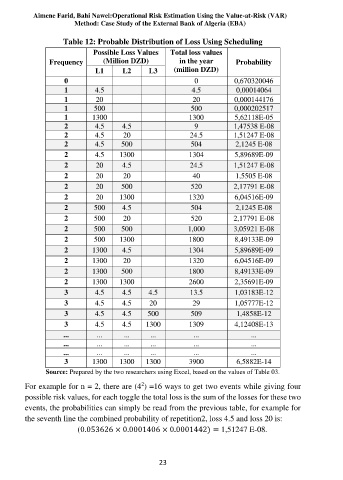
Table 12: Probable Distribution of Loss Using Scheduling
Possible Loss Values Total loss values
Frequency (Million DZD) in the year Probability
L1 L2 L3 (million DZD)
0 0 0,670320046
1 4.5 4.5 0,00014064
1 20 20 0,000144176
1 500 500 0,000202517
1 1300 1300 5,62118E-05
2 4.5 4.5 9 1,47538 E-08
2 4.5 20 24.5 1,51247 E-08
2 4.5 500 504 2,1245 E-08
2 4.5 1300 1304 5,89689E-09
2 20 4.5 24.5 1,51247 E-08
2 20 20 40 1,5505 E-08
2 20 500 520 2,17791 E-08
2 20 1300 1320 6,04516E-09
2 500 4.5 504 2,1245 E-08
2 500 20 520 2,17791 E-08
2 500 500 1,000 3,05921 E-08
2 500 1300 1800 8,49133E-09
2 1300 4.5 1304 5,89689E-09
2 1300 20 1320 6,04516E-09
2 1300 500 1800 8,49133E-09
2 1300 1300 2600 2,35691E-09
3 4.5 4.5 4.5 13.5 1,03183E-12
3 4.5 4.5 20 29 1,05777E-12
3 4.5 4.5 500 509 1,4858E-12
3 4.5 4.5 1300 1309 4,12408E-13
... ... ... ... ... ...
... ... ... ... ... ...
... ... ... ... ... ...
3 1300 1300 1300 3900 6,5882E-14
Source: Prepared by the two researchers using Excel, based on the values of Table 03.
2
For example for n = 2, there are (4 ) =16 ways to get two events while giving four
possible risk values, for each toggle the total loss is the sum of the losses for these two
events, the probabilities can simply be read from the previous table, for example for
the seventh line the combined probability of repetition2, loss 4.5 and loss 20 is:
(0.053626 × 0.0001406 × 0.0001442) = 1,51247 E-08.
23