
Page 81 - Azerbaijan State University of Economics
P. 81
Nurana Sadıgova, Magsud Mirzayev: Service Quality as a Determinant of Patient Satisfaction: An
Empirical Study in the Healthcare Sector
variables: Satisfaction (r = .824), Tangibles (r = .853), Reliability (r = .933),
Responsiveness (r = .929), Assurance (r = .943), and Empathy (r = .930). These results
confirm the existence of strong associations between Service Quality and each of its
components. Similarly, the Satisfaction variable also demonstrates significant positive
correlations with other dimensions: Tangibles (r = .688), Reliability (r = .734),
Responsiveness (r = .777), Assurance (r = .779), and Empathy (r = .800). This
suggests that patient satisfaction is closely linked to various dimensions of service
quality. Tangibles also show statistically significant positive correlations with
Reliability (r = .764), Responsiveness (r = .721), Assurance (r = .742), and Empathy
(r = .710). Furthermore, Reliability, Responsiveness, Assurance, and Empathy exhibit
significant and strong intercorrelations, with correlation values ranging between .814
and .933. Overall, this analysis demonstrates that Service Quality and its key
components—Satisfaction, Tangibles, Reliability, Responsiveness, Assurance, and
Empathy—are strongly and positively interrelated. These high correlation coefficients
suggest that improvements in the various aspects of service quality are likely to
significantly enhance patient satisfaction as well as other related dimensions of
perceived quality.
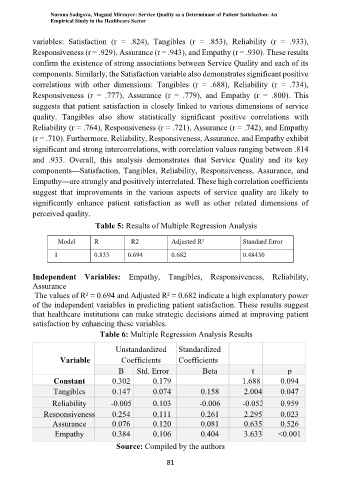
Table 5: Results of Multiple Regression Analysis
Model R R2 Adjusted R² Standard Error
1 0.833 0.694 0.682 0.48430
Independent Variables: Empathy, Tangibles, Responsiveness, Reliability,
Assurance
The values of R² = 0.694 and Adjusted R² = 0.682 indicate a high explanatory power
of the independent variables in predicting patient satisfaction. These results suggest
that healthcare institutions can make strategic decisions aimed at improving patient
satisfaction by enhancing these variables.
Table 6: Multiple Regression Analysis Results
Unstandardized Standardized
Variable Coefficients Coefficients
B Std. Error Beta t p
Constant 0.302 0.179 1.688 0.094
Tangibles 0.147 0.074 0.158 2.004 0.047
Reliability -0.005 0.103 -0.006 -0.052 0.959
Responsiveness 0.254 0.111 0.261 2.295 0.023
Assurance 0.076 0.120 0.081 0.635 0.526
Empathy 0.384 0.106 0.404 3.633 <0.001
Source: Compiled by the authors
81