
Page 88 - Azerbaijan State University of Economics
P. 88
THE JOURNAL OF ECONOMIC SCIENCES: THEORY AND PRACTICE, V.83, # 1, 2026, pp. 82-106
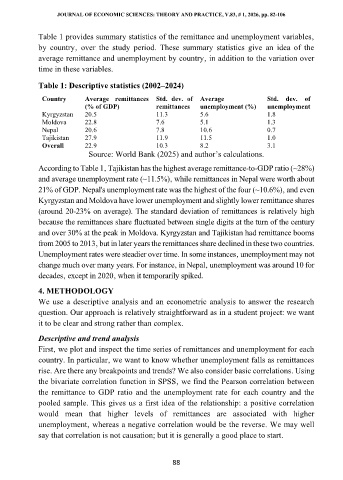
Table 1 provides summary statistics of the remittance and unemployment variables‚
by country‚ over the study period. These summary statistics give an idea of the
average remittance and unemployment by country‚ in addition to the variation over
time in these variables.
Table 1: Descriptive statistics (2002–2024)
Country Average remittances Std. dev. of Average Std. dev. of
(% of GDP) remittances unemployment (%) unemployment
Kyrgyzstan 20.5 11.3 5.6 1.8
Moldova 22.8 7.6 5.1 1.3
Nepal 20.6 7.8 10.6 0.7
Tajikistan 27.9 11.9 11.5 1.0
Overall 22.9 10.3 8.2 3.1
Source: World Bank (2025) and author’s calculations.
According to Table 1‚ Tajikistan has the highest average remittance-to-GDP ratio (~28%)
and average unemployment rate (~11.5%)‚ while remittances in Nepal were worth about
21% of GDP. Nepal's unemployment rate was the highest of the four (~10.6%)‚ and even
Kyrgyzstan and Moldova have lower unemployment and slightly lower remittance shares
(around 20-23% on average). The standard deviation of remittances is relatively high
because the remittances share fluctuated between single digits at the turn of the century
and over 30% at the peak in Moldova. Kyrgyzstan and Tajikistan had remittance booms
from 2005 to 2013‚ but in later years the remittances share declined in these two countries.
Unemployment rates were steadier over time. In some instances‚ unemployment may not
change much over many years. For instance‚ in Nepal‚ unemployment was around 10 for
decades‚ except in 2020‚ when it temporarily spiked.
4. METHODOLOGY
We use a descriptive analysis and an econometric analysis to answer the research
question. Our approach is relatively straightforward as in a student project: we want
it to be clear and strong rather than complex.
Descriptive and trend analysis
First‚ we plot and inspect the time series of remittances and unemployment for each
country. In particular‚ we want to know whether unemployment falls as remittances
rise. Are there any breakpoints and trends? We also consider basic correlations. Using
the bivariate correlation function in SPSS‚ we find the Pearson correlation between
the remittance to GDP ratio and the unemployment rate for each country and the
pooled sample. This gives us a first idea of the relationship: a positive correlation
would mean that higher levels of remittances are associated with higher
unemployment‚ whereas a negative correlation would be the reverse. We may well
say that correlation is not causation; but it is generally a good place to start.
88