
Page 136 - Azerbaijan State University of Economics
P. 136
THE PUBLIC INVESTMENTS IN AZERBAIJAN: THEORETICAL AND PRACTICAL ASPECTS
The portion of state budget and non-budgetary funds in capital investments
done to the state property during the indicated period was equal to 18.2%
and 68.6% respectively. In general the role of the state budget in financing
of capital expenditures during 2000-2010 can be estimated as 37.7% or
45.4% if non-budgetary funds are considered.
100%
59.2
90% 23 25.7 25.7
80% 38.3 43.3 30.6
51.6 46.6
70% 62.2
70
60%
50%
408
40% 77 74.3 74.3
30% 61.7 56.7 69.4
48.4 53.4
20% 37.8
30
10%
0%
2000 2001 2002 2003 2004 2005 2006 2007 2008 2009 2010
Non‐government Government
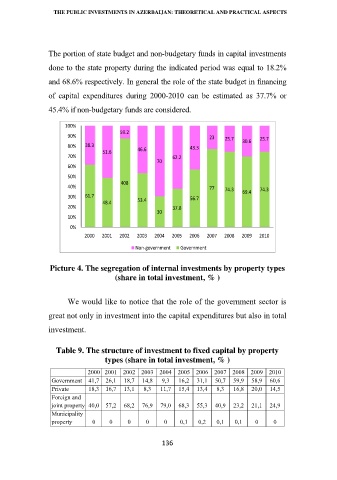
Picture 4. The segregation of internal investments by property types
(share in total investment, % )
We would like to notice that the role of the government sector is
great not only in investment into the capital expenditures but also in total
investment.
Table 9. The structure of investment to fixed capital by property
types (share in total investment, % )
2000 2001 2002 2003 2004 2005 2006 2007 2008 2009 2010
Government 41,7 26,1 18,7 14,8 9,3 16,2 31,1 50,7 59,9 58,9 60,6
Private 18,3 16,7 13,1 8,3 11,7 15,4 13,4 8,3 16,8 20,0 14,5
Foreign and
joint property 40,0 57,2 68,2 76,9 79,0 68,3 55,3 40,9 23,2 21,1 24,9
Municipality
property 0 0 0 0 0 0,1 0,2 0,1 0,1 0 0
136