
Page 22 - Azerbaijan State University of Economics
P. 22
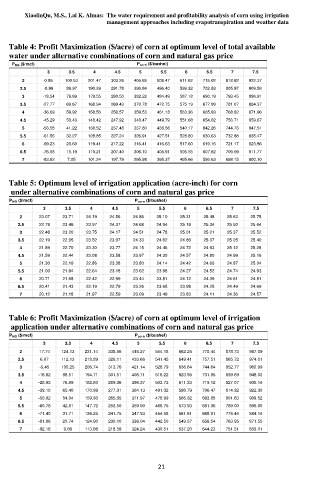
XiaolinQu, M.S., Lal K. Almas:  The water requirement and profitability analysis of corn using irrigation
                                                                            management approaches including evapotranspiration and weather data

               Table 4: Profit Maximization ($/acre) of corn at optimum level of total available
               water under alternative combinations of corn and natural gas price
                P NG  ($/mcf)                         P corn  ($/bushel)
                          3      3.5    4      4.5    5     5.5     6     6.5    7      7.5
                   2      0.86  100.53  201.47  303.26  405.65  508.47  611.62  715.02  818.62  922.37
                  2.5    -8.99  89.97  190.39  291.78  393.84  496.40  599.32  702.53  805.97  909.58
                   3     -18.54  79.69  179.55  280.50  382.22  484.49  587.18  690.19  793.45  896.91
                  3.5    -27.77  69.67  168.94  269.43  370.78  472.75  575.19  677.99  781.07  884.37
                   4     -36.69  59.92  158.56  258.57  359.53  461.18  563.36  665.93  768.82  871.96
                  4.5    -45.29  50.43  148.42  247.92  348.47  449.79  551.68  654.02  756.71  859.67
                   5     -53.58  41.22  138.52  237.48  337.60  438.56  540.17  642.26  744.73  847.51
                  5.5    -61.56  32.27  128.85  227.24  326.91  427.51  528.80  630.63  732.88  835.47
                   6     -69.23  23.60  119.41  217.22  316.41  416.63  517.60  619.16  721.17  823.56
                  6.5    -76.58  15.19  110.21  207.40  306.10  405.91  506.55  607.82  709.59  811.77
                   7     -83.62  7.05  101.24  197.79  295.98  395.37  495.66  596.63  698.15  800.10


               Table 5: Optimum level of irrigation application (acre-inch) for corn
                under alternative combinations of corn and natural gas price
               P NG  ($/mcf)                         P corn  ($/bushel)
                         3      3.5    4      4.5    5      5.5    6      6.5    7      7.5
                  2     23.07  23.71  24.19  24.56  24.86  25.10  25.31  25.48  25.63  25.75
                  2.5   22.78  23.46  23.97  24.37  24.68  24.94  25.16  25.34  25.50  25.64
                  3     22.48  23.20  23.75  24.17  24.51  24.78  25.01  25.21  25.37  25.52
                  3.5   22.19  22.95  23.52  23.97  24.33  24.62  24.86  25.07  25.25  25.40
                  4     21.89  22.70  23.30  23.77  24.15  24.46  24.72  24.93  25.12  25.28
                  4.5   21.59  22.44  23.08  23.58  23.97  24.30  24.57  24.80  24.99  25.16
                  5     21.30  22.19  22.86  23.38  23.80  24.14  24.42  24.66  24.87  25.04
                  5.5   21.00  21.94  22.64  23.18  23.62  23.98  24.27  24.52  24.74  24.93
                  6     20.71  21.68  22.42  22.99  23.44  23.81  24.12  24.39  24.61  24.81
                  6.5   20.41  21.43  22.19  22.79  23.26  23.65  23.98  24.25  24.49  24.69
                  7     20.12  21.18  21.97  22.59  23.09  23.49  23.83  24.11  24.36  24.57


               Table 6: Profit Maximization ($/acre) of corn at optimum level of irrigation
                application under alternative combinations of corn and natural gas price
               P NG  ($/mcf)                         P corn  ($/bushel)
                         3      3.5    4      4.5    5      5.5    6      6.5    7      7.5
                  2     17.74  124.13  231.14  338.56  446.27  554.18  662.25  770.44  878.73  987.09
                  2.5   6.07   112.13  218.89  326.11  433.66  541.45  649.41  757.51  865.72  974.01
                  3     -5.45  100.25  206.74  313.76  421.14  528.79  636.64  744.64  852.77  960.99
                  3.5   -16.82  88.51  194.71  301.51  408.71  516.22  623.95  731.85  839.89  948.03
                  4     -28.03  76.89  182.80  289.36  396.37  503.73  611.33  719.12  827.07  935.14
                  4.5   -39.10  65.40  170.99  277.31  384.13  491.32  598.79  706.47  814.32  922.30
                  5     -50.02  54.04  159.30  265.35  371.97  478.99  586.32  693.88  801.63  909.52
                  5.5   -60.78  42.81  147.72  253.50  359.90  466.75  573.93  681.36  789.00  896.80
                  6     -71.40  31.71  136.25  241.75  347.93  454.58  561.61  668.91  776.44  884.14
                  6.5   -81.86  20.74  124.90  230.10  336.04  442.50  549.37  656.54  763.95  871.55
                  7     -92.18  9.89  113.66  218.56  324.24  430.51  537.20  644.23  751.51  859.01


                                                            21