
Page 23 - Azerbaijan State University of Economics
P. 23
THE JOURNAL OF ECONOMIC SCIENCES: THEORY AND PRACTICE, V.70, # 1, 2013, pp. 4-22
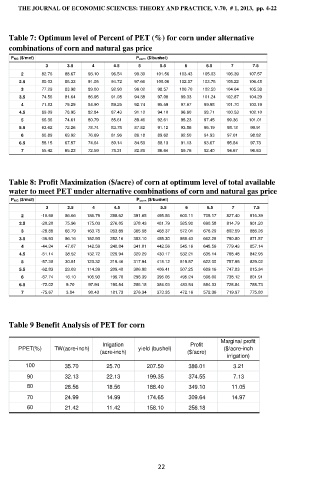
Table 7: Optimum level of Percent of PET (%) for corn under alternative
combinations of corn and natural gas price
P NG ($/mcf) P corn ($/bushel)
3 3.5 4 4.5 5 5.5 6 6.5 7 7.5
2 82.76 88.67 93.10 96.54 99.30 101.56 103.43 105.03 106.39 107.57
2.5 80.03 86.33 91.05 94.72 97.66 100.06 102.07 103.76 105.22 106.48
3 77.29 83.98 89.00 92.90 96.02 98.57 100.70 102.50 104.04 105.38
3.5 74.56 81.64 86.95 91.08 94.38 97.08 99.33 101.24 102.87 104.29
4 71.83 79.29 84.90 89.25 92.74 95.59 97.97 99.98 101.70 103.19
4.5 69.09 76.95 82.84 87.43 91.10 94.10 96.60 98.71 100.53 102.10
5 66.36 74.61 80.79 85.61 89.46 92.61 95.23 97.45 99.36 101.01
5.5 63.62 72.26 78.74 83.78 87.82 91.12 93.86 96.19 98.18 99.91
6 60.89 69.92 76.69 81.96 86.18 89.62 92.50 94.93 97.01 98.82
6.5 58.15 67.57 74.64 80.14 84.53 88.13 91.13 93.67 95.84 97.73
7 55.42 65.23 72.59 78.31 82.89 86.64 89.76 92.40 94.67 96.63
Table 8: Profit Maximization ($/acre) of corn at optimum level of total available
water to meet PET under alternative combinations of corn and natural gas price
P NG ($/mcf) P corn ($/bushel)
3 3.5 4 4.5 5 5.5 6 6.5 7 7.5
2 -10.90 86.66 186.79 288.62 391.65 495.56 600.11 705.17 827.40 916.39
2.5 -20.20 75.96 175.03 276.05 378.43 481.79 585.90 690.58 814.79 901.20
3 -28.88 65.79 163.75 263.89 365.58 468.37 572.01 676.29 802.59 886.26
3.5 -36.93 56.16 152.93 252.16 353.10 455.30 558.43 662.28 790.80 871.57
4 -44.34 47.07 142.59 240.84 341.01 442.56 545.16 648.56 779.43 857.14
4.5 -51.14 38.52 132.72 229.94 329.29 430.17 532.21 635.14 768.48 842.95
5 -57.30 30.51 123.32 219.46 317.94 418.12 519.57 622.00 757.95 829.02
5.5 -62.83 23.03 114.39 209.40 306.98 406.41 507.25 609.16 747.83 815.34
6 -67.74 16.10 105.93 199.76 296.39 395.05 495.24 596.60 738.12 801.91
6.5 -72.02 9.70 97.94 190.54 286.18 384.03 483.54 584.33 728.84 788.73
7 -75.67 3.84 90.43 181.73 276.34 373.35 472.16 572.36 719.97 775.80
Table 9 Benefit Analysis of PET for corn
Marginal profit
Irrigation Profit
PPET(%) TW(acre-inch) yield (bushel) ($/acre-inch
(acre-inch) ($/acre)
irrigation)
100 35.70 25.70 207.50 386.01 3.21
90 32.13 22.13 199.35 374.55 7.13
80 28.56 18.56 188.40 349.10 11.05
70 24.99 14.99 174.65 309.64 14.97
60 21.42 11.42 158.10 256.18
22