
Page 71 - Azerbaijan State University of Economics
P. 71
Murad Yusifov: Modelling the inflationary processes and forecasting:an application of ARIMA,
SARIMA models
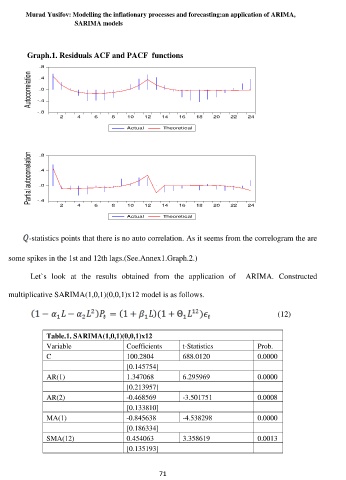
Graph.1. Residuals ACF and PACF functions
.8
Autocorrelation -.4
.4
.0
-.8
2 4 6 8 10 12 14 16 18 20 22 24
Actual Theoretical
Partial autocorrelation .8
.4
.0
-.4
2 4 6 8 10 12 14 16 18 20 22 24
Actual Theoretical
-statistics points that there is no auto correlation. As it seems from the correlogram the are
some spikes in the 1st and 12th lags.(See.Annex1.Graph.2.)
Let`s look at the results obtained from the application of ARIMA. Constructed
multiplicative SARIMA(1,0,1)(0,0,1)x12 model is as follows.
(12)
Table.1. SARIMA(1,0,1)(0,0,1)x12
Variable Coefficients t-Statistics Prob.
C 100.2804 688.0120 0.0000
[0.145754]
AR(1) 1.347068 6.295969 0.0000
[0.213957]
AR(2) -0.468569 -3.501751 0.0008
[0.133810]
MA(1) -0.845638 -4.538298 0.0000
[0.186334]
SMA(12) 0.454063 3.358619 0.0013
[0.135193]
71