Page 72 - Azerbaijan State University of Economics
P. 72

THE JOURNAL OF ECONOMIC SCIENCES: THEORY AND PRACTICE, V.71, # 2, 2014, pp. 66-80


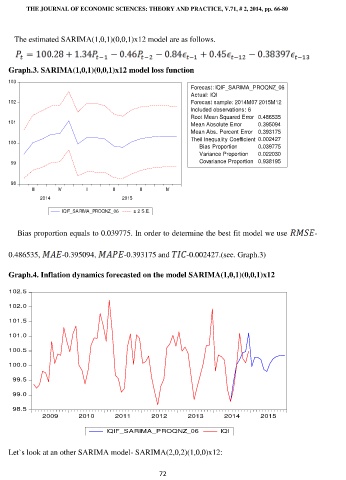
                 The estimated SARIMA(1,0,1)(0,0,1)x12 model are as follows.


               Graph.3. SARIMA(1,0,1)(0,0,1)x12 model loss function
               103
                                                                       Forecast: IQIF_SARIMA_PROQNZ_06
                                                                       Actual: IQI
               102                                                     Forecast sample: 2014M07 2015M12
                                                                       Included observations: 6
                                                                       Root Mean Squared Error  0.486535
               101                                                     Mean Absolute Error        0.395094
                                                                       Mean Abs. Percent Error  0.393175
                                                                       Theil Inequality Coefficient  0.002427
               100
                                                                            Bias Proportion          0.039775
                                                                            Variance Proportion    0.022030
                99                                                          Covariance Proportion   0.938195


                98
                      III     IV       I       II      III     IV
                         2014                     2015

                                IQIF_SARIMA_PROQNZ_06  ± 2 S.E.


                  Bias proportion equals to 0.039775. In order to determine the best fit model we use       -


               0.486535,        -0.395094,        -0.393175 and      -0.002427.(see. Graph.3)


               Graph.4. Inflation dynamics forecasted on the model SARIMA(1,0,1)(0,0,1)x12

               102.5

               102.0
               101.5

               101.0

               100.5

               100.0

                 99.5
                 99.0

                 98.5
                          2009       2010       2011       2012       2013       2014       2015

                                             IQIF_SARIMA_PROQNZ_06              IQI


               Let`s look at an other SARIMA model- SARIMA(2,0,2)(1,0,0)x12:


                                                             72
   67   68   69   70   71   72   73   74   75   76   77