
Page 18 - Azerbaijan State University of Economics
P. 18
THE JOURNAL OF ECONOMIC SCIENCES: THEORY AND PRACTICE, V.78, # 1, 2021, pp. 4-25
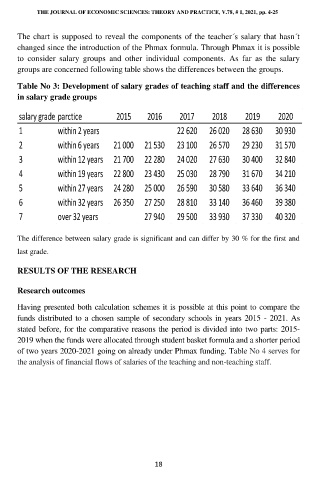
The chart is supposed to reveal the components of the teacher´s salary that hasn´t
changed since the introduction of the Phmax formula. Through Phmax it is possible
to consider salary groups and other individual components. As far as the salary
groups are concerned following table shows the differences between the groups.
Table No 3: Development of salary grades of teaching staff and the differences
in salary grade groups
salary grade parctice 2015 2016 2017 2018 2019 2020
1 within 2 years 22 620 26 020 28 630 30 930
2 within 6 years 21 000 21 530 23 100 26 570 29 230 31 570
3 within 12 years 21 700 22 280 24 020 27 630 30 400 32 840
4 within 19 years 22 800 23 430 25 030 28 790 31 670 34 210
5 within 27 years 24 280 25 000 26 590 30 580 33 640 36 340
6 within 32 years 26 350 27 250 28 810 33 140 36 460 39 380
7 over 32 years 27 940 29 500 33 930 37 330 40 320
The difference between salary grade is significant and can differ by 30 % for the first and
last grade.
RESULTS OF THE RESEARCH
Research outcomes
Having presented both calculation schemes it is possible at this point to compare the
funds distributed to a chosen sample of secondary schools in years 2015 - 2021. As
stated before, for the comparative reasons the period is divided into two parts: 2015-
2019 when the funds were allocated through student basket formula and a shorter period
of two years 2020-2021 going on already under Phmax funding. Table No 4 serves for
the analysis of financial flows of salaries of the teaching and non-teaching staff.
18