
Page 14 - Azerbaijan State University of Economics
P. 14
THE JOURNAL OF ECONOMIC SCIENCES: THEORY AND PRACTICE, V.78, # 2, 2021, pp. 4-16
It should be noted that the study examined the normal and exponential distribution of
the scores collected by applicant in all specialty groups for both Azerbaijani and Russian
sections, as well as the scores obtained by bachelors in the admission exams to master
level. However, the results for all of these groups are subject to neither normal nor
exponential distribution. That is to say that the scores are assymmetrically distributed.
As it can be seen from tables 2 and 3 in both cases the mean of sequence is greater
than its mod, and this means that these sequences are asymmetric to the right.
ECONOMETRIC EVALUATION OF SCORES OBTAINED IN THE
ADMISSION EXAMS
Evaluation of the dependence of average scores on time. An econometric evaluation
was made of the dependence of the average scores obtained by the applicants from
time. For this, the following specification of the regression equation was considered:
Log(mean_total)=c(1)+ c(2) @TREND (2)
The result of the econometric evaluation of the regression equation in the EViews
application package (Eviews 9) was as follows:
LOG(MEAN_TOTAL) = 5.1093116842 + 0.0101236457358*@TREND (3)
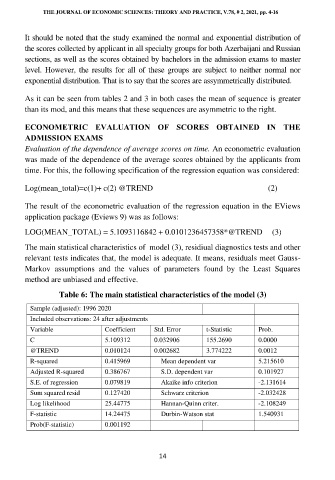
The main statistical characteristics of model (3), residiual diagnostics tests and other
relevant tests indicates that, the model is adequate. It means, residuals meet Gauss-
Markov assumptions and the values of parameters found by the Least Squares
method are unbiased and effective.
Table 6: The main statistical characteristics of the model (3)
Sample (adjusted): 1996 2020
Included observations: 24 after adjustments
Variable Coefficient Std. Error t-Statistic Prob.
C 5.109312 0.032906 155.2690 0.0000
@TREND 0.010124 0.002682 3.774222 0.0012
R-squared 0.415969 Mean dependent var 5.215610
Adjusted R-squared 0.386767 S.D. dependent var 0.101927
S.E. of regression 0.079819 Akaike info criterion -2.131614
Sum squared resid 0.127420 Schwarz criterion -2.032428
Log likelihood 25.44775 Hannan-Quinn criter. -2.108249
F-statistic 14.24475 Durbin-Watson stat 1.540931
Prob(F-statistic) 0.001192
14