
Page 111 - Azerbaijan State University of Economics
P. 111
Nazrin Mammadova: The Effect of Investment Decisions on Firms’ Profitability (Empirical
Study on Listed Companies)
Change in assets as indicated by the asset growth ratio had a mean of 0.17, minimum
value of -0.84 and maximum value of 4.44 with standard deviation of 0.56 meaning
that study includes both low and high investments made companies with average of
relatively low asset growth companies. Liquidity as indicated by current ratio had a
mean of 1.68 with minimum value of 0.59 and maximum value of 12.13 which shows
that sample includes mostly companies with good liquidity condition while the
standard deviation shows that the data is well distributed via having both higher and
lower liquid firms. In general, the relatively high ratios show that most businesses had
a wide margin of safety. Debt to equity ratios as an indicator of financial leverage had
a mean of 0.91 with minimum value of -10.73 and maximum value of 12.21 showing
the existince of highly geared companies even with equity deficit meaning that sample
consists of companies having been provided by mostly debt financing.
Inferential statistics
The advance analysis started by firstly defining whether data for analysis is normally
distributed or not by use of normality test for the purpose of the definition of further
tests that is going to be used during the research. Then the degree of relationship
between the various variables was found using correlation analysis. Spearman
Correlation test was used to determine whether there is a significant difference
between investment decision and the performance of firms listed on the New York
Stock Exchange, while the regression analysis was used to determine the impact of
the investment decision variables on firms' profitability.
Normality test
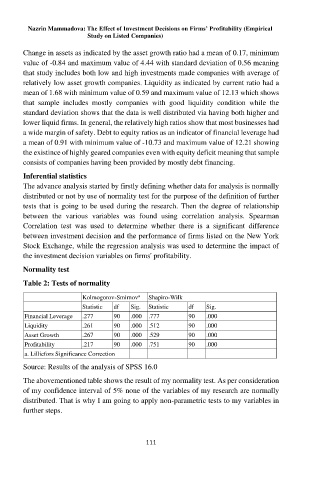
Table 2: Tests of normality
Kolmogorov-Smirnov Shapiro-Wilk
a
Statistic df Sig. Statistic df Sig.
Financial Leverage .277 90 .000 .777 90 .000
Liquidity .261 90 .000 .512 90 .000
Asset Growth .267 90 .000 .529 90 .000
Profitability .217 90 .000 .751 90 .000
a. Lilliefors Significance Correction
Source: Results of the analysis of SPSS 16.0
The abovementioned table shows the result of my normality test. As per consideration
of my confidence interval of 5% none of the variables of my research are normally
distributed. That is why I am going to apply non-parametric tests to my variables in
further steps.
111