
Page 129 - Azerbaijan State University of Economics
P. 129
THE JOURNAL OF ECONOMIC SCIENCES: THEORY AND PRACTICE, V.81, # 2, 2024, pp. 117-142
Thus, the model's fitness was assessed using a number of criteria, including the
Goodness-of-Fit Index (GFI), Adjusted Goodness-of-Fit Index (AGFI), Comparative
Fit Index (CFI), Root Mean Square Error of Approximation (RMSEA), and Chi-
square (Alshihabat & Atan, 2020; De Roeck & Farooq, 2018; Newman et al., 2014).
RESULTS AND DISCUSSION
Descriptive Statistics, reliability and correlation
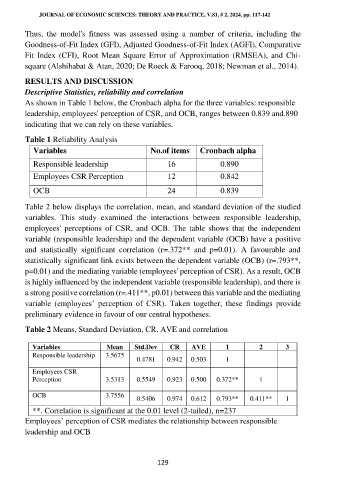
As shown in Table 1 below, the Cronbach alpha for the three variables: responsible
leadership, employees' perception of CSR, and OCB, ranges between 0.839 and.890
indicating that we can rely on these variables.
Table 1 Reliability Analysis
Variables No.of items Cronbach alpha
Responsible leadership 16 0.890
Employees CSR Perception 12 0.842
OCB 24 0.839
Table 2 below displays the correlation, mean, and standard deviation of the studied
variables. This study examined the interactions between responsible leadership,
employees' perceptions of CSR, and OCB. The table shows that the independent
variable (responsible leadership) and the dependent variable (OCB) have a positive
and statistically significant correlation (r=.372** and p=0.01). A favourable and
statistically significant link exists between the dependent variable (OCB) (r=.793**,
p=0.01) and the mediating variable (employees' perception of CSR). As a result, OCB
is highly influenced by the independent variable (responsible leadership), and there is
a strong positive correlation (r=.411**, p0.01) between this variable and the mediating
variable (employees’ perception of CSR). Taken together, these findings provide
preliminary evidence in favour of our central hypotheses.
Table 2 Means, Standard Deviation, CR, AVE and correlation
Variables Mean Std.Dev CR AVE 1 2 3
Responsible leadership 3.5675
0.4781 0.942 0.503 1
Employees CSR
Perception 3.5313 0.5549 0.923 0.500 0.372** 1
OCB 3.7556
0.5406 0.974 0.612 0.793** 0.411** 1
**. Correlation is significant at the 0.01 level (2-tailed), n=237
Employees’ perception of CSR mediates the relationship between responsible
leadership and OCB
129