
Page 16 - Azerbaijan State University of Economics
P. 16
THE JOURNAL OF ECONOMIC SCIENCES: THEORY AND PRACTICE, V.81, # 2, 2024, pp. 4-29
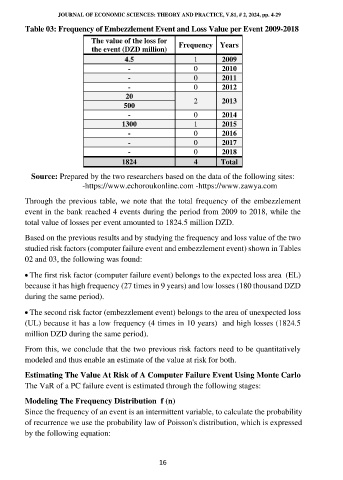
Table 03: Frequency of Embezzlement Event and Loss Value per Event 2009-2018
The value of the loss for
the event (DZD million) Frequency Years
4.5 1 2009
- 0 2010
- 0 2011
- 0 2012
20
500 2 2013
- 0 2014
1300 1 2015
- 0 2016
- 0 2017
- 0 2018
1824 4 Total
Source: Prepared by the two researchers based on the data of the following sites:
-https://www.echoroukonline.com -https://www.zawya.com
Through the previous table, we note that the total frequency of the embezzlement
event in the bank reached 4 events during the period from 2009 to 2018, while the
total value of losses per event amounted to 1824.5 million DZD.
Based on the previous results and by studying the frequency and loss value of the two
studied risk factors (computer failure event and embezzlement event) shown in Tables
02 and 03, the following was found:
• The first risk factor (computer failure event) belongs to the expected loss area (EL)
because it has high frequency (27 times in 9 years) and low losses (180 thousand DZD
during the same period).
• The second risk factor (embezzlement event) belongs to the area of unexpected loss
(UL) because it has a low frequency (4 times in 10 years) and high losses (1824.5
million DZD during the same period).
From this, we conclude that the two previous risk factors need to be quantitatively
modeled and thus enable an estimate of the value at risk for both.
Estimating The Value At Risk of A Computer Failure Event Using Monte Carlo
The VaR of a PC failure event is estimated through the following stages:
Modeling The Frequency Distribution f (n)
Since the frequency of an event is an intermittent variable, to calculate the probability
of recurrence we use the probability law of Poisson's distribution, which is expressed
by the following equation:
16