
Page 24 - Azerbaijan State University of Economics
P. 24
Nina Poyda-Nosyk, Serhii Lehenchuk, Victoriia Makarovych, Iryna Polishchuk, Tetiana Zavalii: Analytical
Procedures in Audit As A Tool For Predicting The Risks Of Financial Statement Fraud In Marketing Companies
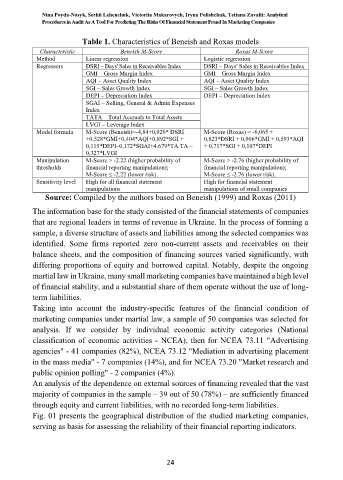
Table 1. Characteristics of Beneish and Roxas models
Characteristic Beneish M-Score Roxas M-Score
Method Linear regression Logistic regression
Regressors DSRI – Days' Sales in Receivables Index DSRI – Days' Sales in Receivables Index
GMI – Gross Margin Index GMI – Gross Margin Index
AQI – Asset Quality Index AQI – Asset Quality Index
SGI – Sales Growth Index SGI – Sales Growth Index
DEPI – Depreciation Index DEPI – Depreciation Index
SGAI – Selling, General & Admin Expenses
Index
TATA – Total Accruals to Total Assets
LVGI – Leverage Index
Model formula M-Score (Beneish)=-4,84+0,920* DSRI M-Score (Roхas) = -6,065 +
+0,528*GMI+0,404*AQI+0,892*SGI + 0,823*DSRI + 0,906*GMI + 0,593*AQI
0,115*DEPI–0,172*SGAI+4,679*TA TA – + 0,717*SGI + 0,107*DEPI
0,327*LVGI
Manipulation M-Score > -2.22 (higher probability of M-Score > -2.76 (higher probability of
thresholds financial reporting manipulation); financial reporting manipulation);
M-Score ≤ -2.22 (lower risk). M-Score ≤ -2.76 (lower risk).
Sensitivity level High for all financial statement High for financial statement
manipulations manipulations of small companies
Source: Compiled by the authors based on Beneish (1999) and Roxas (2011)
The information base for the study consisted of the financial statements of companies
that are regional leaders in terms of revenue in Ukraine. In the process of forming a
sample, a diverse structure of assets and liabilities among the selected companies was
identified. Some firms reported zero non-current assets and receivables on their
balance sheets, and the composition of financing sources varied significantly, with
differing proportions of equity and borrowed capital. Notably, despite the ongoing
martial law in Ukraine, many small marketing companies have maintained a high level
of financial stability, and a substantial share of them operate without the use of long-
term liabilities.
Taking into account the industry-specific features of the financial condition of
marketing companies under martial law, a sample of 50 companies was selected for
analysis. If we consider by individual economic activity categories (National
classification of economic activities - NCEA), then for NCEA 73.11 "Advertising
agencies" - 41 companies (82%), NCEA 73.12 "Mediation in advertising placement
in the mass media" - 7 companies (14%), and for NCEA 73.20 "Market research and
public opinion polling" - 2 companies (4%).
An analysis of the dependence on external sources of financing revealed that the vast
majority of companies in the sample – 39 out of 50 (78%) – are sufficiently financed
through equity and current liabilities, with no recorded long-term liabilities.
Fig. 01 presents the geographical distribution of the studied marketing companies,
serving as basis for assessing the reliability of their financial reporting indicators.
24