
Page 25 - Azerbaijan State University of Economics
P. 25
THE JOURNAL OF ECONOMIC SCIENCES: THEORY AND PRACTICE, V.82, # 1, 2025, pp. 19-35
Vinnytsia region 7
Odesa region 1
Mykolaiv region 2
Cherkasy region 3
Dnipropetrovsk region 3
Poltava region 4
Ternopil region 7
Kharkiv region 7
Lviv region 2
Kyiv region 14
0 2 4 6 8 10 12 14 16
Number of researched marketing companies, units.
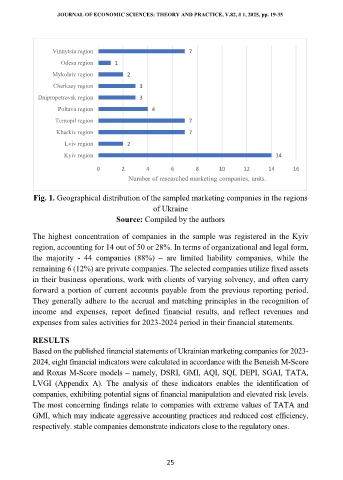
Fig. 1. Geographical distribution of the sampled marketing companies in the regions
of Ukraine
Source: Compiled by the authors
The highest concentration of companies in the sample was registered in the Kyiv
region, accounting for 14 out of 50 or 28%. In terms of organizational and legal form,
the majority - 44 companies (88%) – are limited liability companies, while the
remaining 6 (12%) are private companies. The selected companies utilize fixed assets
in their business operations, work with clients of varying solvency, and often carry
forward a portion of current accounts payable from the previous reporting period.
They generally adhere to the accrual and matching principles in the recognition of
income and expenses, report defined financial results, and reflect revenues and
expenses from sales activities for 2023-2024 period in their financial statements.
RESULTS
Based on the published financial statements of Ukrainian marketing companies for 2023-
2024, eight financial indicators were calculated in accordance with the Beneish M-Score
and Roxas M-Score models – namely, DSRI, GMI, AQI, SQI, DEPI, SGAI, TATA,
LVGI (Appendix A). The analysis of these indicators enables the identification of
companies, exhibiting potential signs of financial manipulation and elevated risk levels.
The most concerning findings relate to companies with extreme values of TATA and
GMI, which may indicate aggressive accounting practices and reduced cost efficiency,
respectively. stable companies demonstrate indicators close to the regulatory ones.
25