Page 132 - Azerbaijan State University of Economics
P. 132

Yadulla Hasanli, Gunay Rahimli, Fuad Quliyev, Mattia Ferrari: Evaluation of Sectoral
                                                          Foreign Trade Elasticities of Azerbaijan


                    In the study, the CET function was also estimated for the service sector, and the
                    results were as follows:

                                                                                 )
                                         Y   =  . 0  96  . 0 (  29E −  . 0  29  +  . 0  71D −  . 0 29 −  . 0  71
                                                                             j
                                           j
                                                              j

                                                       R2=0.99, DW=1.99
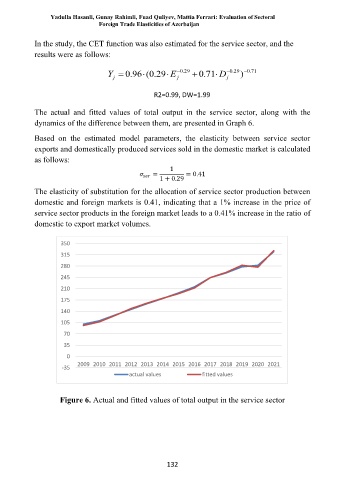
                    The  actual  and  fitted  values  of  total  output  in  the  service  sector,  along  with  the
                    dynamics of the difference between them, are presented in Graph 6.

                    Based  on  the  estimated  model  parameters,  the  elasticity  between  service  sector
                    exports and domestically produced services sold in the domestic market is calculated
                    as follows:
                                                            1
                                                              =  = 0.41
                                                         1 + 0.29

                    The elasticity of substitution for the allocation of service sector production between
                    domestic and foreign markets is 0.41, indicating that a 1% increase in the price of
                    service sector products in the foreign market leads to a 0.41% increase in the ratio of
                    domestic to export market volumes.


                           350
                           315
                           280
                           245
                           210
                           175
                           140

                           105
                            70
                            35
                             0
                                2009 2010 2011 2012 2013 2014 2015 2016 2017 2018 2019 2020 2021
                            -35
                                                actual values        fitted values


                           Figure 6. Actual and fitted values of total output in the service sector


                                                           132
   127   128   129   130   131   132   133   134   135   136   137