
Page 129 - Azerbaijan State University of Economics
P. 129
THE JOURNAL OF ECONOMIC SCIENCES: THEORY AND PRACTICE, V.82, # 2, 2025, pp. 117-137
1
− = = 3.3
1 − 0.7
As can be seen, the elasticity of substitution in the non-oil sector exceeds unity.
According to the first-order condition, a 1% increase in the price of imported products
results in an approximate 3.2% decrease in the ratio of imported to domestic product
volumes. This indicates that locally produced goods in the non-oil sector can
substitute for imported goods. In other words, the potential output of the non-oil sector
in the country is higher than its current production.
270
240
210
180
150
120
90
60
30
0
-30 2009 2010 2011 2012 2013 2014 2015 2016 2017 2018 2019 2020 2021
actual values fitted values
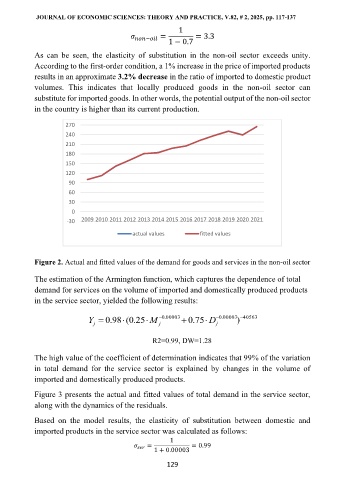
Figure 2. Actual and fitted values of the demand for goods and services in the non-oil sector
The estimation of the Armington function, which captures the dependence of total
demand for services on the volume of imported and domestically produced products
in the service sector, yielded the following results:
Y = . 0 98 . 0 ( 25 M − . 0 00003 + . 0 75 D − . 0 00003 − 40563
)
j j j
R2=0.99, DW=1.28
The high value of the coefficient of determination indicates that 99% of the variation
in total demand for the service sector is explained by changes in the volume of
imported and domestically produced products.
Figure 3 presents the actual and fitted values of total demand in the service sector,
along with the dynamics of the residuals.
Based on the model results, the elasticity of substitution between domestic and
imported products in the service sector was calculated as follows:
1
= 1 + 0.00003 = 0.99
129