
Page 127 - Azerbaijan State University of Economics
P. 127
THE JOURNAL OF ECONOMIC SCIENCES: THEORY AND PRACTICE, V.82, # 2, 2025, pp. 117-137
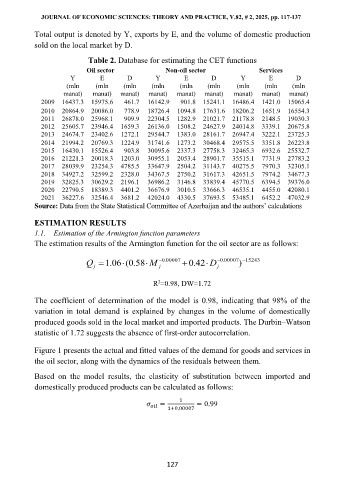
Total output is denoted by Y, exports by E, and the volume of domestic production
sold on the local market by D.
Table 2. Database for estimating the CET functions
Oil sector Non-oil sector Services
Y E D Y E D Y E D
(mln (mln (mln (mln (mln (mln (mln (mln (mln
manat) manat) manat) manat) manat) manat) manat) manat) manat)
2009 16437.3 15975.6 461.7 16142.9 901.8 15241.1 16486.4 1421.0 15065.4
2010 20864.9 20086.0 778.9 18726.4 1094.8 17631.6 18206.2 1651.9 16554.3
2011 26878.0 25968.1 909.9 22304.5 1282.9 21021.7 21178.8 2148.5 19030.3
2012 25605.7 23946.4 1659.3 26136.0 1508.2 24627.9 24014.8 3339.1 20675.8
2013 24674.7 23402.6 1272.1 29544.7 1383.0 28161.7 26947.4 3222.1 23725.3
2014 21994.2 20769.3 1224.9 31741.6 1273.2 30468.4 29575.5 3351.8 26223.8
2015 16430.1 15526.4 903.8 30095.6 2337.3 27758.3 32465.3 6932.6 25532.7
2016 21221.3 20018.3 1203.0 30955.1 2053.4 28901.7 35515.1 7731.9 27783.2
2017 28039.9 23254.3 4785.5 33647.9 2504.2 31143.7 40275.5 7970.3 32305.1
2018 34927.2 32599.2 2328.0 34367.5 2750.2 31617.3 42651.5 7974.2 34677.3
2019 32825.3 30629.2 2196.1 36986.2 3146.8 33839.4 45770.5 6394.5 39376.0
2020 22790.5 18389.3 4401.2 36676.9 3010.5 33666.3 46535.1 4455.0 42080.1
2021 36227.6 32546.4 3681.2 42024.0 4330.5 37693.5 53485.1 6452.2 47032.9
Source: Data from the State Statistical Committee of Azerbaijan and the authors’ calculations
ESTIMATION RESULTS
1.1. Estimation of the Armington function parameters
The estimation results of the Armington function for the oil sector are as follows:
Q j = . 1 06 . 0 ( 58M − j . 0 00007 + . 0 42 D − j . 0 00007 − 15243
)
2
R =0.98, DW=1.72
The coefficient of determination of the model is 0.98, indicating that 98% of the
variation in total demand is explained by changes in the volume of domestically
produced goods sold in the local market and imported products. The Durbin–Watson
statistic of 1.72 suggests the absence of first-order autocorrelation.
Figure 1 presents the actual and fitted values of the demand for goods and services in
the oil sector, along with the dynamics of the residuals between them.
Based on the model results, the elasticity of substitution between imported and
domestically produced products can be calculated as follows:
1
= 1+0.00007 = 0.99
127