
Page 80 - Azerbaijan State University of Economics
P. 80
THE JOURNAL OF ECONOMIC SCIENCES: THEORY AND PRACTICE, V.71, # 2, 2014, pp. 66-80
.*| . | .*| . | 21 -0.154 -0.142 177.13 0.000
. | . | . | . | 22 0.007 -0.045 177.13 0.000
. |*. | . | . | 23 0.176 -0.057 180.52 0.000
. |** | . |*. | 24 0.310 0.093 191.17 0.000
. |** | . | . | 25 0.307 0.037 201.85 0.000
. |*. | .*| . | 26 0.176 -0.072 205.45 0.000
. | . | . | . | 27 0.017 0.019 205.48 0.000
.*| . | . | . | 28 -0.095 -0.033 206.58 0.000
**| . | . | . | 29 -0.220 -0.051 212.58 0.000
**| . | . | . | 30 -0.287 0.002 223.06 0.000
**| . | . | . | 31 -0.257 -0.004 231.62 0.000
.*| . | . |*. | 32 -0.171 0.084 235.52 0.000
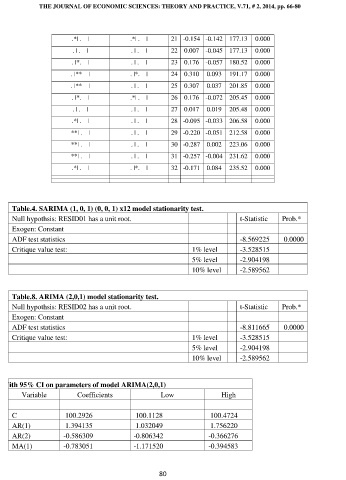
Table.4. SARIMA (1, 0, 1) (0, 0, 1) x12 model stationarity test.
Null hypothsis: RESID01 has a unit root. t-Statistic Prob.*
Exogen: Constant
ADF test statistics -8.569225 0.0000
Critique value test: 1% level -3.528515
5% level -2.904198
10% level -2.589562
Table.8. ARIMA (2,0,1) model stationarity test.
Null hypothsis: RESID02 has a unit root. t-Statistic Prob.*
Exogen: Constant
ADF test statistics -8.811665 0.0000
Critique value test: 1% level -3.528515
5% level -2.904198
10% level -2.589562
Table.9. With 95% CI on parameters of model ARIMA(2,0,1)
Variable Coefficients Low High
C 100.2926 100.1128 100.4724
AR(1) 1.394135 1.032049 1.756220
AR(2) -0.586309 -0.806342 -0.366276
MA(1) -0.783051 -1.171520 -0.394583
80