
Page 26 - Azerbaijan State University of Economics
P. 26
THE JOURNAL OF ECONOMIC SCIENCES: THEORY AND PRACTICE, V.77, # 2, 2020, pp. 4-39
Table (4) shows that the general average of the dimensions of strategic agility reached
(3.82), which means that the perceptions of the study sample members of the
dimensions of strategic agility among workers in the Aqaba Special Economic Zone
Authority are of a high level. By analyzing the dimensions of strategic agility, it is clear
that the strategic sensitivity dimension ranked first with an arithmetic average of (3.87)
and a standard deviation (0.50), followed by the strategic response after an arithmetic
mean of (3.83) and a standard deviation (0.52), while it came in the last place. After
organizational capabilities, with a mean of (3.75), and a standard deviation of (0.54).
TEST HYPOTHESES OF THE STUDY:
Before applying the regression analysis to test the study hypotheses, some tests were
performed in order to ensure that the data fit the assumptions of the regression analysis,
as follows: Regarding the assumption that there is no high correlation between the
independent variables "Multi-Collinearity", the researcher conducted the coefficient of
inflation of variance "Variance" Inflation Factor- VIF “, and the permissible variance
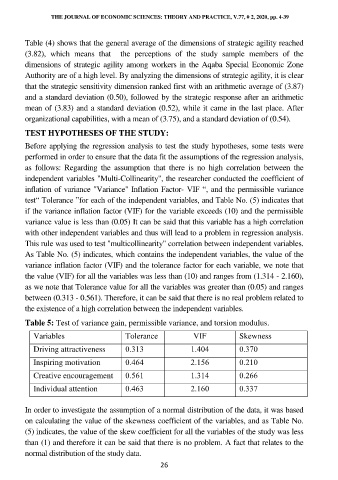
test“ Tolerance ”for each of the independent variables, and Table No. (5) indicates that
if the variance inflation factor (VIF) for the variable exceeds (10) and the permissible
variance value is less than (0.05) It can be said that this variable has a high correlation
with other independent variables and thus will lead to a problem in regression analysis.
This rule was used to test "multicollinearity" correlation between independent variables.
As Table No. (5) indicates, which contains the independent variables, the value of the
variance inflation factor (VIF) and the tolerance factor for each variable, we note that
the value (VIF) for all the variables was less than (10) and ranges from (1.314 - 2.160),
as we note that Tolerance value for all the variables was greater than (0.05) and ranges
between (0.313 - 0.561). Therefore, it can be said that there is no real problem related to
the existence of a high correlation between the independent variables.
Table 5: Test of variance gain, permissible variance, and torsion modulus.
Variables Tolerance VIF Skewness
Driving attractiveness 0.313 1.404 0.370
Inspiring motivation 0.464 2.156 0.210
Creative encouragement 0.561 1.314 0.266
Individual attention 0.463 2.160 0.337
In order to investigate the assumption of a normal distribution of the data, it was based
on calculating the value of the skewness coefficient of the variables, and as Table No.
(5) indicates, the value of the skew coefficient for all the variables of the study was less
than (1) and therefore it can be said that there is no problem. A fact that relates to the
normal distribution of the study data.
26