
Page 62 - Azerbaijan State University of Economics
P. 62
THE JOURNAL OF ECONOMIC SCIENCES: THEORY AND PRACTICE, V.80, # 1, 2023, pp. 54-66
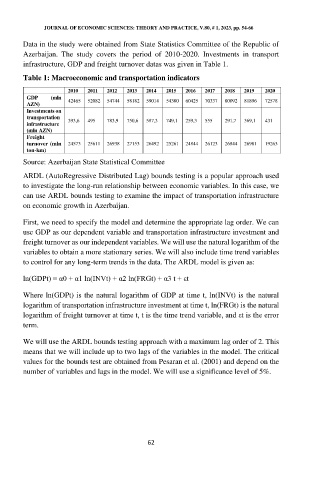
Data in the study were obtained from State Statistics Committee of the Republic of
Azerbaijan. The study covers the period of 2010-2020. Investments in transport
infrastructure, GDP and freight turnover datas was given in Table 1.
Table 1: Macroeconomic and transportation indicators
2010 2011 2012 2013 2014 2015 2016 2017 2018 2019 2020
GDP (mln 42465 52082 54744 58182 59014 54380 60425 70337 80092 81896 72578
AZN)
Investments on
transportation
infrastructure 393,6 495 783,9 750,6 587,3 749,1 259,3 555 291,7 369,1 431
(mln AZN)
Freight
turnover (mln 24573 25611 26938 27153 26492 25261 24844 26123 26844 26981 19263
ton-km)
Source: Azerbaijan State Statistical Committee
ARDL (AutoRegressive Distributed Lag) bounds testing is a popular approach used
to investigate the long-run relationship between economic variables. In this case, we
can use ARDL bounds testing to examine the impact of transportation infrastructure
on economic growth in Azerbaijan.
First, we need to specify the model and determine the appropriate lag order. We can
use GDP as our dependent variable and transportation infrastructure investment and
freight turnover as our independent variables. We will use the natural logarithm of the
variables to obtain a more stationary series. We will also include time trend variables
to control for any long-term trends in the data. The ARDL model is given as:
ln(GDPt) = α0 + α1 ln(INVt) + α2 ln(FRGt) + α3 t + εt
Where ln(GDPt) is the natural logarithm of GDP at time t, ln(INVt) is the natural
logarithm of transportation infrastructure investment at time t, ln(FRGt) is the natural
logarithm of freight turnover at time t, t is the time trend variable, and εt is the error
term.
We will use the ARDL bounds testing approach with a maximum lag order of 2. This
means that we will include up to two lags of the variables in the model. The critical
values for the bounds test are obtained from Pesaran et al. (2001) and depend on the
number of variables and lags in the model. We will use a significance level of 5%.
62