
Page 110 - Azerbaijan State University of Economics
P. 110
THE JOURNAL OF ECONOMIC SCIENCES: THEORY AND PRACTICE, V.81, # 2, 2024, pp. 104-116
The data demonstrates that expenditure on general education by educational level,
expressed as a % of GDP, indicates that the elementary education subsector is the
most substantial, whereas higher and secondary education are relatively lesser. This
signifies that elementary education accounts for almost one-third of the GDP share,
indicating that China's educational system prioritises obligatory and free education.
The most significant investment takes place during the transition from primary to
secondary education, whereas pre-primary education represents just 0.2% of GDP,
exceeding secondary education by 0.4% between the years 2015 and 2019 (Hu, 2022).
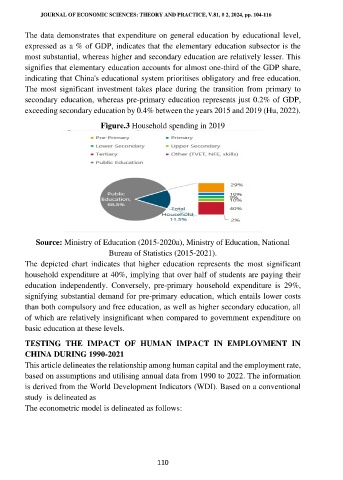
Figure.3 Household spending in 2019
Source: Ministry of Education (2015-2020a), Ministry of Education, National
Bureau of Statistics (2015-2021).
The depicted chart indicates that higher education represents the most significant
household expenditure at 40%, implying that over half of students are paying their
education independently. Conversely, pre-primary household expenditure is 29%,
signifying substantial demand for pre-primary education, which entails lower costs
than both compulsory and free education, as well as higher secondary education, all
of which are relatively insignificant when compared to government expenditure on
basic education at these levels.
TESTING THE IMPACT OF HUMAN IMPACT IN EMPLOYMENT IN
CHINA DURING 1990-2021
This article delineates the relationship among human capital and the employment rate,
based on assumptions and utilising annual data from 1990 to 2022. The information
is derived from the World Development Indicators (WDI). Based on a conventional
study is delineated as
The econometric model is delineated as follows :
110