
Page 42 - Azerbaijan State University of Economics
P. 42
THE JOURNAL OF ECONOMIC SCIENCES: THEORY AND PRACTICE, V.82, # 2, 2025, pp. 32-60
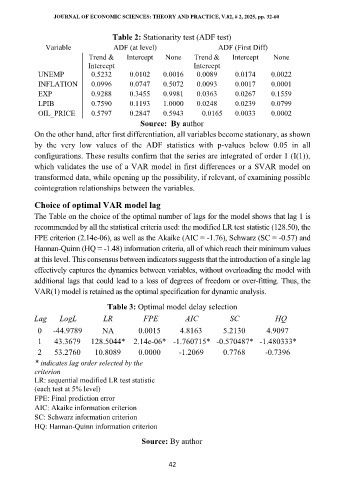
Table 2: Stationarity test (ADF test)
Variable ADF (at level) ADF (First Diff)
Trend & Intercept None Trend & Intercept None
Intercept Intercept
UNEMP 0.5232 0.0102 0.0016 0.0089 0.0174 0.0022
INFLATION 0.0996 0.0747 0.5072 0.0093 0.0017 0.0001
EXP 0.9288 0.3455 0.9981 0.0363 0.0267 0.1559
LPIB 0.7590 0.1193 1.0000 0.0248 0.0239 0.0799
OIL_PRICE 0.5797 0.2847 0.5943 0.0165 0.0033 0.0002
Source: By author
On the other hand, after first differentiation, all variables become stationary, as shown
by the very low values of the ADF statistics with p-values below 0.05 in all
configurations. These results confirm that the series are integrated of order 1 (I(1)),
which validates the use of a VAR model in first differences or a SVAR model on
transformed data, while opening up the possibility, if relevant, of examining possible
cointegration relationships between the variables.
Choice of optimal VAR model lag
The Table on the choice of the optimal number of lags for the model shows that lag 1 is
recommended by all the statistical criteria used: the modified LR test statistic (128.50), the
FPE criterion (2.14e-06), as well as the Akaike (AIC = -1.76), Schwarz (SC = -0.57) and
Hannan-Quinn (HQ = -1.48) information criteria, all of which reach their minimum values
at this level. This consensus between indicators suggests that the introduction of a single lag
effectively captures the dynamics between variables, without overloading the model with
additional lags that could lead to a loss of degrees of freedom or over-fitting. Thus, the
VAR(1) model is retained as the optimal specification for dynamic analysis.
Table 3: Optimal model delay selection
Lag LogL LR FPE AIC SC HQ
0 -44.9789 NA 0.0015 4.8163 5.2130 4.9097
1 43.3679 128.5044* 2.14e-06* -1.760715* -0.570487* -1.480333*
2 53.2760 10.8089 0.0000 -1.2069 0.7768 -0.7396
* indicates lag order selected by the
criterion
LR: sequential modified LR test statistic
(each test at 5% level)
FPE: Final prediction error
AIC: Akaike information criterion
SC: Schwarz information criterion
HQ: Hannan-Quinn information criterion
Source: By author
42