
Page 85 - Azerbaijan State University of Economics
P. 85
THE JOURNAL OF ECONOMIC SCIENCES: THEORY AND PRACTICE, V.82, # 2, 2025, pp. 79-95
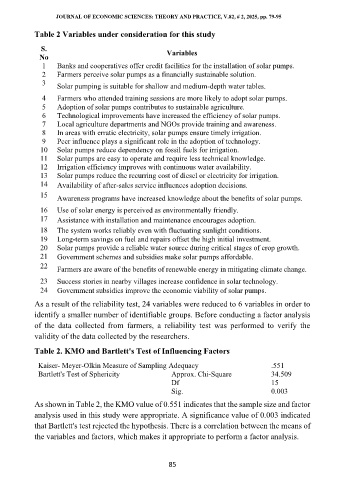
Table 2 Variables under consideration for this study
S. Variables
No
1 Banks and cooperatives offer credit facilities for the installation of solar pumps.
2 Farmers perceive solar pumps as a financially sustainable solution.
3 Solar pumping is suitable for shallow and medium-depth water tables.
4 Farmers who attended training sessions are more likely to adopt solar pumps.
5 Adoption of solar pumps contributes to sustainable agriculture.
6 Technological improvements have increased the efficiency of solar pumps.
7 Local agriculture departments and NGOs provide training and awareness.
8 In areas with erratic electricity, solar pumps ensure timely irrigation.
9 Peer influence plays a significant role in the adoption of technology.
10 Solar pumps reduce dependency on fossil fuels for irrigation.
11 Solar pumps are easy to operate and require less technical knowledge.
12 Irrigation efficiency improves with continuous water availability.
13 Solar pumps reduce the recurring cost of diesel or electricity for irrigation.
14 Availability of after-sales service influences adoption decisions.
15 Awareness programs have increased knowledge about the benefits of solar pumps.
16 Use of solar energy is perceived as environmentally friendly.
17 Assistance with installation and maintenance encourages adoption.
18 The system works reliably even with fluctuating sunlight conditions.
19 Long-term savings on fuel and repairs offset the high initial investment.
20 Solar pumps provide a reliable water source during critical stages of crop growth.
21 Government schemes and subsidies make solar pumps affordable.
22 Farmers are aware of the benefits of renewable energy in mitigating climate change.
23 Success stories in nearby villages increase confidence in solar technology.
24 Government subsidies improve the economic viability of solar pumps.
As a result of the reliability test, 24 variables were reduced to 6 variables in order to
identify a smaller number of identifiable groups. Before conducting a factor analysis
of the data collected from farmers, a reliability test was performed to verify the
validity of the data collected by the researchers.
Table 2. KMO and Bartlett's Test of Influencing Factors
Kaiser- Meyer-Olkin Measure of Sampling Adequacy .551
Bartlett's Test of Sphericity Approx. Chi-Square 34.509
Df 15
Sig. 0.003
As shown in Table 2, the KMO value of 0.551 indicates that the sample size and factor
analysis used in this study were appropriate. A significance value of 0.003 indicated
that Bartlett's test rejected the hypothesis. There is a correlation between the means of
the variables and factors, which makes it appropriate to perform a factor analysis.
85