
Page 87 - Azerbaijan State University of Economics
P. 87
THE JOURNAL OF ECONOMIC SCIENCES: THEORY AND PRACTICE, V.82, # 2, 2025, pp. 79-95
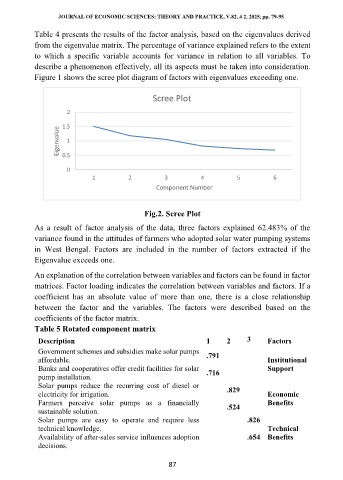
Table 4 presents the results of the factor analysis, based on the eigenvalues derived
from the eigenvalue matrix. The percentage of variance explained refers to the extent
to which a specific variable accounts for variance in relation to all variables. To
describe a phenomenon effectively, all its aspects must be taken into consideration.
Figure 1 shows the scree plot diagram of factors with eigenvalues exceeding one.
Scree Plot
2
1.5
Eigenvalue 0.5 1
0
1 2 3 4 5 6
Component Number
Fig.2. Scree Plot
As a result of factor analysis of the data, three factors explained 62.483% of the
variance found in the attitudes of farmers who adopted solar water pumping systems
in West Bengal. Factors are included in the number of factors extracted if the
Eigenvalue exceeds one.
An explanation of the correlation between variables and factors can be found in factor
matrices. Factor loading indicates the correlation between variables and factors. If a
coefficient has an absolute value of more than one, there is a close relationship
between the factor and the variables. The factors were described based on the
coefficients of the factor matrix.
Table 5 Rotated component matrix
Description 1 2 3 Factors
Government schemes and subsidies make solar pumps .791
affordable. Institutional
Banks and cooperatives offer credit facilities for solar Support
pump installation. .716
Solar pumps reduce the recurring cost of diesel or .829
electricity for irrigation. Economic
Farmers perceive solar pumps as a financially .524 Benefits
sustainable solution.
Solar pumps are easy to operate and require less .826
technical knowledge. Technical
Availability of after-sales service influences adoption .654 Benefits
decisions.
87