
Page 44 - Azerbaijan State University of Economics
P. 44
THE JOURNAL OF ECONOMIC SCIENCES: THEORY AND PRACTICE, V.83, # 1, 2026, pp. 40-57
enhance operational efficiency and decision-making, enabling dynamic logistics
adjustments and improved risk management (Daios & Stefanou, 2025). Particularly
post-pandemic, many multinational corporations increasingly favor establishing
multi-hub or regional value chain layouts to enhance resilience and navigate
globalization uncertainties.
These transformations are steering global value chains toward greater digitalization,
intelligence, and decentralization. Conversely, in international trade, the proportion of
high-value-added exports driven by AI adoption rates further reshapes positions
within global value chains.
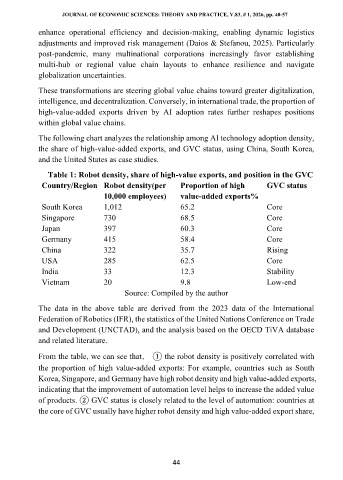
The following chart analyzes the relationship among AI technology adoption density,
the share of high-value-added exports, and GVC status, using China, South Korea,
and the United States as case studies.
Table 1: Robot density, share of high-value exports, and position in the GVC
Country/Region Robot density(per Proportion of high GVC status
10,000 employees) value-added exports%
South Korea 1,012 65.2 Core
Singapore 730 68.5 Core
Japan 397 60.3 Core
Germany 415 58.4 Core
China 322 35.7 Rising
USA 285 62.5 Core
India 33 12.3 Stability
Vietnam 20 9.8 Low-end
Source: Compiled by the author
The data in the above table are derived from the 2023 data of the International
Federation of Robotics (IFR), the statistics of the United Nations Conference on Trade
and Development (UNCTAD), and the analysis based on the OECD TiVA database
and related literature.
From the table, we can see that, ① the robot density is positively correlated with
the proportion of high value-added exports: For example, countries such as South
Korea, Singapore, and Germany have high robot density and high value-added exports,
indicating that the improvement of automation level helps to increase the added value
of products. ② GVC status is closely related to the level of automation: countries at
the core of GVC usually have higher robot density and high value-added export share,
44