
Page 48 - Azerbaijan State University of Economics
P. 48
THE JOURNAL OF ECONOMIC SCIENCES: THEORY AND PRACTICE, V.83, # 1, 2026, pp. 40-57
Table 2: Global trade structure trend table (2010 vs 2023)
Indicator 2010 2023 Trend Data source
Share of global goods Approx. 75% Approx. Slight UNCTAD
trade 73% decline
Number of regional Significant WTO RTA
trade agreements Approx. 220 374 increase Database
(RTAs)
Share of services trade Approx. 15% Approx. Notable UNCTAD
in global trade 27% rise
Share of digital Rapid
services trade in Approx. 30% Over 50% growth UNCTAD
services trade
Source: Compiled by the author
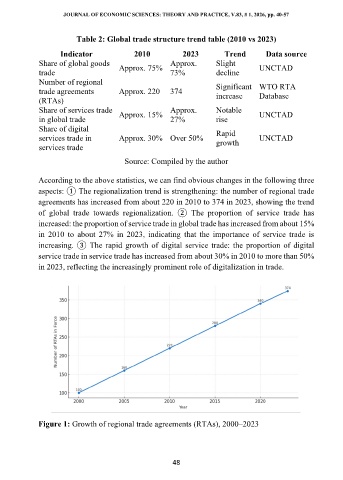
According to the above statistics, we can find obvious changes in the following three
aspects: ① The regionalization trend is strengthening: the number of regional trade
agreements has increased from about 220 in 2010 to 374 in 2023, showing the trend
of global trade towards regionalization. ② The proportion of service trade has
increased: the proportion of service trade in global trade has increased from about 15%
in 2010 to about 27% in 2023, indicating that the importance of service trade is
increasing. ③ The rapid growth of digital service trade: the proportion of digital
service trade in service trade has increased from about 30% in 2010 to more than 50%
in 2023, reflecting the increasingly prominent role of digitalization in trade.
Figure 1: Growth of regional trade agreements (RTAs), 2000–2023
48